This workshop will show you how to:
- Use Geolocation service
- Setup geofencing rules
- Build a Progressive Web App (PWA)
To complete this workshop you will need:
- Visual Studio Code
- Node.js LTS and NPM
- 8th Walls Engine
- Connected Environments Postcard Image Front
- Connected Environments Postcard Image Reverse
- QEOP bridges locations
- Mobile Device (suggested Android for using the WebXR API)
Languages used:
- HTML
- JavaScript
Additional resources
When sharing a Babylon.js project, as with many other development projects, not every file and folder needs to be included. Environment files, such as .env, should not be shared because they may contain sensitive information, including API keys or access credentials. The node_modules folder can also be excluded because it contains installed dependencies that can be downloaded again using package.json and the pacakge-lock.json file. Similarly, the dist folder contains generated build output and can usually be recreated from the source files.
create a new folder for this Workshop and add the previous project avoiding .env, node_modules and dist folders
navigate to the folder of the project from the terminal cd [name of your project]
Run npm install to install all the dependencies listed in package.json
When ready, run npm run dev to launch the local development server and access the WebApp from the address and ports listed in the terminal.
Augmented reality can also be used effectively in outdoor settings. These applications typically take advantage of the device's geolocation capabilities to position digital content within the physical environment. While simple location-based experiences can be developed using the Geolocation API.
Next, create a panel to display the GPS data
- In
index.html, add a panel after thecanvaselement to display GPS data
<div id="gps-panel" class="glass">
  <div class="panel-header">
      GPS DATA
  </div>

  <div class="panel-content">
      <div class="info-row">
          <span class="label">Latitude</span>
          <span id="latitude" class="value">--</span>
      </div>

      <div class="info-row">
          <span class="label">Longitude</span>
          <span id="longitude" class="value">--</span>
      </div>

      <div class="info-row">
          <span class="label">Altitude</span>
          <span id="altitude" class="value">-- m</span>
      </div>

      <div class="info-row">
          <span class="label">Accuracy</span>
          <span id="accuracy" class="pill">-- m</span>
      </div>

      <div class="info-row">
          <span class="label">Updated</span>
          <span id="timestamp" class="value">--</span>
      </div>
  </div>
</div>
- Create a new
style.cssfile in thesrcfolder and update the page styling to use the new stylesheet.
#gps-panel {
    position: fixed;
    bottom: 20px;
    right: 20px;
    width: 280px;
    z-index: 1000;
}

.glass {
    background: rgba(20, 20, 30, 0.75);
    backdrop-filter: blur(12px);
    -webkit-backdrop-filter: blur(12px);
    border: 1px solid rgba(255, 255, 255, 0.15);
    border-radius: 16px;
    color: #fff;
    overflow: hidden;
    box-shadow: 0 8px 24px rgba(0, 0, 0, 0.25);
}

.panel-header {
    padding: 12px 16px;
    font-size: 0.8rem;
    font-weight: 700;
    letter-spacing: 1px;
    text-transform: uppercase;
    background: rgba(255, 255, 255, 0.08);
    border-bottom: 1px solid rgba(255, 255, 255, 0.1);
}

.panel-content {
    padding: 12px 16px;
}

.info-row {
    display: flex;
    justify-content: space-between;
    align-items: center;
    margin-bottom: 10px;
}

.info-row:last-child {
    margin-bottom: 0;
}

.label {
    color: rgba(255,255,255,0.65);
    font-size: 0.85rem;
}

.value {
    font-weight: 600;
    font-size: 0.9rem;
    text-align: right;
}

.pill {
    background: rgba(0, 150, 255, 0.2);
    color: #8fd3ff;
    padding: 4px 10px;
    border-radius: 999px;
    font-size: 0.8rem;
    font-weight: 600;
}
- At the top of
index.js, import the newstyle.cssfile
import './style.css'
To keep the application maintainable, the geolocation script will be placed in a separate file
- Create a new
geolocation.jsfile in thesrc/utilsfolder
/**
* Geolocation using watchPosition().
* Location data updates automatically whenever the device position changes.
* Requires user permission and a secure HTTPS connection.
*/
export class GeoLocationService {
    constructor() {
        // The browser returns an ID when location tracking starts.
        // We store it so we can stop tracking later.
        this.watchId = null;
    }

// Starts listening for location changes.
    start(onUpdate, onError) {
        // Check whether the browser supports geolocation.
        // Very old browsers or restricted environments may not.
        if (!navigator.geolocation) {
            onError?.(new Error("Geolocation not supported"));
            return;
        }

// Start watching the user's location.
// The browser will call one of the two callback functions:
// 1. Success callback when a location is found
// 2. Error callback if location retrieval fails
        this.watchId = navigator.geolocation.watchPosition(
            (position) => {

                onUpdate?.({
                    // Latitude: north/south position on Earth
                    latitude: position.coords.latitude,
                    // Longitude: east/west position on Earth
                    longitude: position.coords.longitude,
                    // Height above sea level in meters.
                    altitude: position.coords.altitude,
                    // Accuracy radius in meters.
                    // Example: accuracy = 10 means the real position
                    // is estimated to be within 10 meters.
                    accuracy: position.coords.accuracy
                });

            },
            (error) => {
                onError?.(error);
            },
            {
                // Ask for the most accurate location available.
                // May use GPS, which consumes more battery.
                enableHighAccuracy: true,
                maximumAge: 1000,
                timeout: 10000
            }
        );
    }

    stop() {
        if (this.watchId !== null) {
            navigator.geolocation.clearWatch(this.watchId);
        }
    }
}
The geolocation function will be use in the createContent.js
- First, let's clean up the script so that it contains only the essential elements (especially if the script was copied from a previous project).
import { Vector3 } from "@babylonjs/core/Maths/math.vector";
import { TransformNode } from "@babylonjs/core/Meshes/transformNode";
import { HemisphericLight } from "@babylonjs/core/Lights/hemisphericLight";
import { DirectionalLight } from "@babylonjs/core/Lights/directionalLight";

export async function createContent(scene) {
    // Root node for content attached to the main image target
    const originModel = new TransformNode("anchorModel", scene);
    originModel.setEnabled(false);

    // Add basic scene lighting
    const hemisphericLight = new HemisphericLight(
        "hemisphericLight",
        new Vector3(0, 1, 0),
        scene
    );
    hemisphericLight.intensity = 1;

    const directionalLight = new DirectionalLight(
        "directionalLight",
        new Vector3(1, -2, -1),
        scene
    );
    directionalLight.intensity = 1;

    // Return the objects needed by the tracking module
    return {
        originModel
    };
}
- import the
GeoLocationServiceclass on top of thecreateContent.js
import {GeoLocationService} from "./geolocation.js";
- and inside the
function createContent(scene), after theoriginModeladd the part of code to start the geolocation and populate the UI
//Get references to the GPS panel elements
const latitudeEl = document.getElementById("latitude");
const longitudeEl = document.getElementById("longitude");
const altitudeEl = document.getElementById("altitude");
const accuracyEl = document.getElementById("accuracy");
const timestampEl = document.getElementById("timestamp");

// Create the geolocation service
const geo = new GeoLocationService();

// Start listening for GPS updates
geo.start(
    (gps) => {

        // Update the panel with the latest values
        latitudeEl.textContent = gps.latitude.toFixed(6);
        longitudeEl.textContent = gps.longitude.toFixed(6);
        altitudeEl.textContent =
            gps.altitude !== null
                ? `${gps.altitude.toFixed(2)} m`
                : "N/A";

        accuracyEl.textContent = `${gps.accuracy.toFixed(1)} m`;

        // Show when the data was last updated
        timestampEl.textContent = new Date().toLocaleTimeString();

        console.log(gps);
    },

    (error) => {

        // Display the error in the panel
        timestampEl.textContent = `Error: ${error.message}`;
        console.error(error);
    }
);
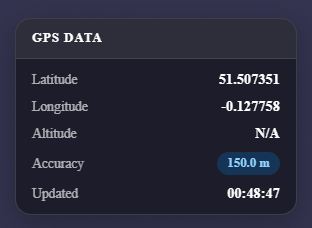
Emulating GPS Data
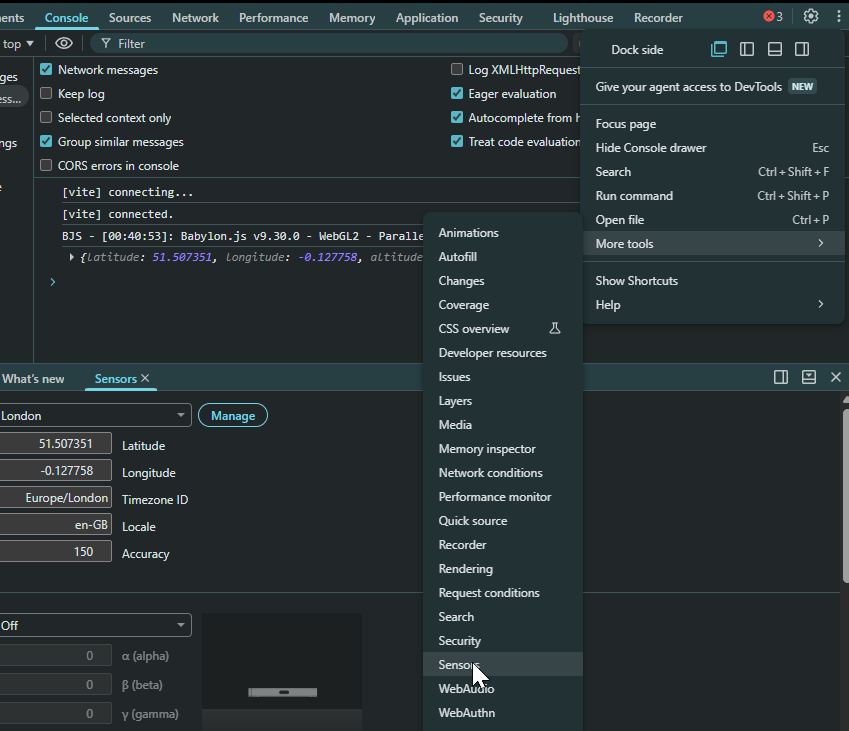
In many cases, we develop and test applications indoors, where GPS signals are often weak or unavailable. This can make it difficult to test outdoor AR experiences that rely on geolocation data. Fortunately, Chromium-based browsers provide useful tools for emulating a range of mobile device sensors, including GPS location. This allows us to test and debug location-based applications without leaving our development environment.
- Open the browser's Developer Tools (F12 or ctrl+shift+I)
- if the
Sensorstab is not visible, click the three dotsâ‹® in Developer Tools and selectMore tools -> Sensors - in the
Sensorspanel, use theLocationdrop-down menu to select a predefined location or choose Custom location.
At this point, we can use the GPS data as a variable to trigger specific content, datasets, or audio depending on the user's location. A simple approach is to create a buffer of a certain distance around the GPS location and trigger content whenever the user enters that area. For more advanced applications, we can define precise geospatial boundaries and test whether the user is inside or outside those areas.
This can be achieved using well-known geospatial libraries such as turf.js: an open-source geospatial analysis library that provides a wide range of tools for spatial operations, including measuring distances, creating buffers, performing point-in-polygon tests, and analysing geographic data using GeoJSON formats.
- Install the library using
npm install @turf/turf
- download the QEOP bridges locations and place it in the
publicfolder - create a new file
geofenceManager.jsin thesrc/utilsfolder
import { point } from "@turf/helpers";
import distance from "@turf/distance";

export class GeofenceManager {
    // activationDistance = radius (in metres) used to trigger content
    constructor(geojson, activationDistance = 25) {
        this.features = geojson.features;
        this.activationDistance = activationDistance;
        // Tracks features currently active
        this.activeFeatures = new Set();
    }
    /**
    * Called whenever the user's position changes.
    * Checks which locations are nearby and triggers enter/exit events.
    */
    update(lat, lon) {
        const userPoint = point([lon, lat]);

        let nearestFeature = null;
        let nearestDistance = Infinity;

        for (const feature of this.features) {
            // Distance between user and feature (metres)
            const dist = distance(
                userPoint,
                feature,
                { units: "meters" }
            );

            const id = feature.properties.id;
            // Keep track of the nearest feature
            if (dist < nearestDistance) {
                nearestDistance = dist;
                nearestFeature = feature;
            }

            // User entered the activation area
            if (
                dist <= this.activationDistance &&
                !this.activeFeatures.has(id)
            ) {
                this.activeFeatures.add(id);

                console.log(`Entered ${id}`);
            }

            // User left the activation area
            if (
                dist > this.activationDistance &&
                this.activeFeatures.has(id)
            ) {
                this.activeFeatures.delete(id);

                console.log(`Exited ${id}`);
            }
        }

        return {
            nearestFeature,
            nearestDistance,
            activeFeatures: [...this.activeFeatures]
        };
    }

    /**
    * Returns a feature using its ID.
    */
    getFeature(id) {
        return this.features.find(
            feature => feature.properties.id === id
        );
    }

    /**
    * Returns the nearest feature to the user.
    */
    getNearest(lat, lon) {

        const userPoint = point([lon, lat]);

        let nearestFeature = null;
        let nearestDistance = Infinity;

        for (const feature of this.features) {

            const dist = distance(
                userPoint,
                feature,
                { units: "meters" }
            );

            if (dist < nearestDistance) {
                nearestDistance = dist;
                nearestFeature = feature;
            }
        }

        return {
            feature: nearestFeature,
            distance: nearestDistance
        };
    }
}
- in the
createContent.jsadd the import of the script
import { GeofenceManager } from './geofenceManager.js';
- then import the
geojsondataset and create theGeofenceManagerjust after the definition of theoriginModel
const geojson = await fetch("./QEOP_bridges.geojson").then(result => result.json());
const bridgeManager = new GeofenceManager(geojson, 25);
- finally, to trigger the zones, inside
geo.start, pass bothgps.latitudeandgps.longitudeto theGeofenceManger
bridgeManager.update(gps.latitude,gps.longitude);
Using the Developer Tool of the browser we can detect when a user enters or exits a trigger zone.
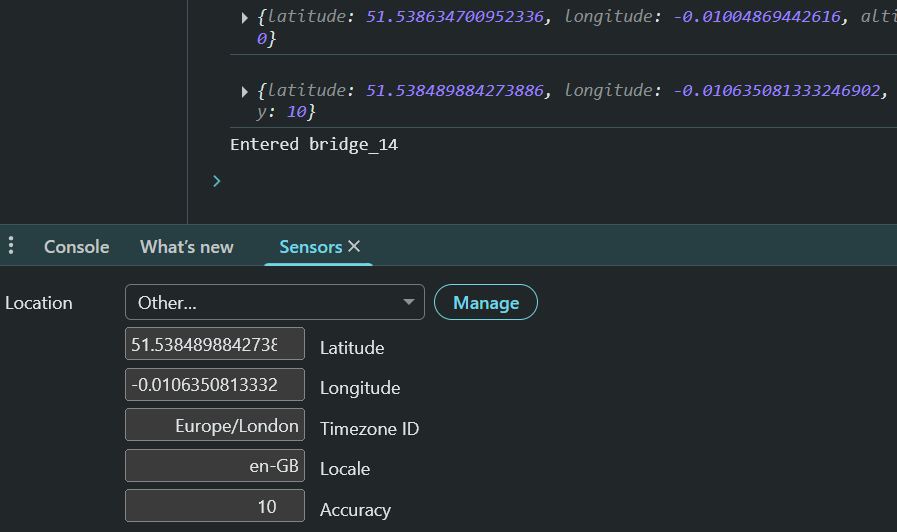
With geolocation and geofencing now working, we can introduce an AR experience that uses the same marker to provide location-specific content based on the user's position.
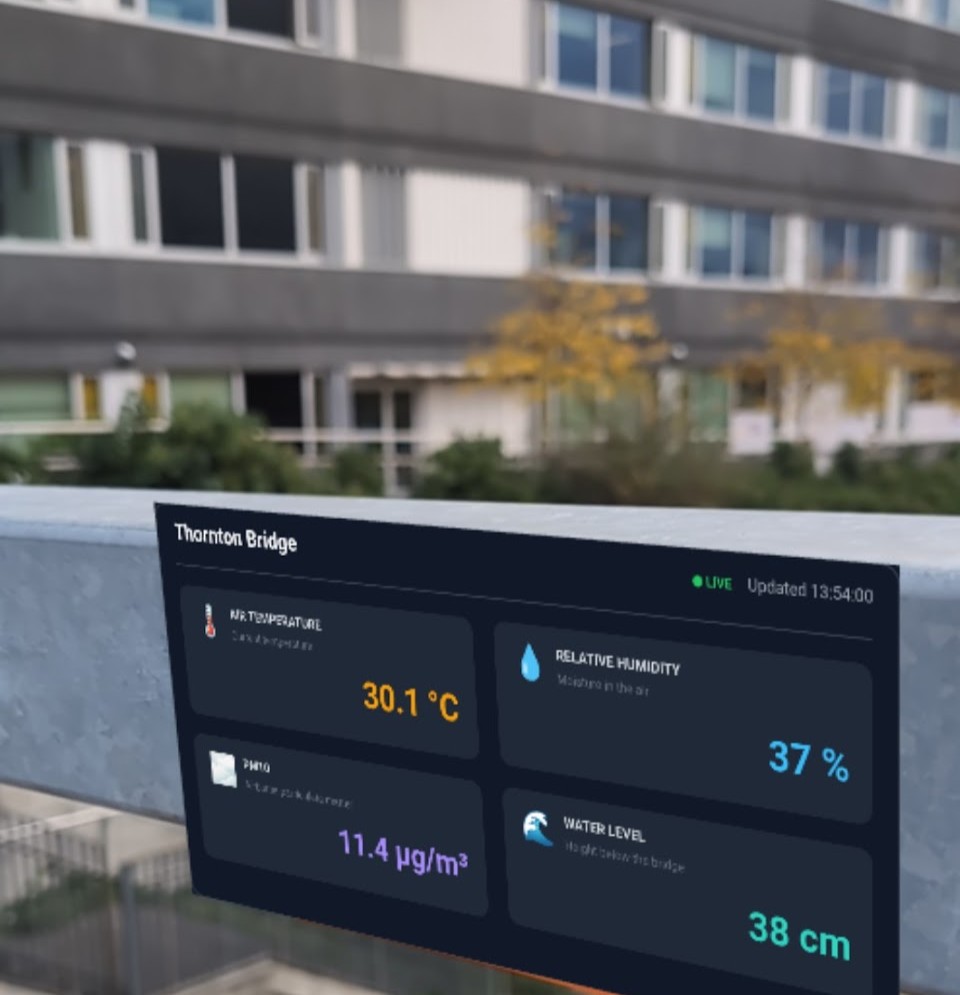
We are going to develop a simple dashboard that consumes data generated at the bridge locations within the Queen Elizabeth Olympic Park, reusing the framework introduced in the previous workshops.
- Install the
echartsandmqttlibraries
npm install echarts mqtt
- create the mqttController.js and the mqttManager.js in the
src/utilsfolder
Designing Dashboard
Building an effective dashboard can be achieved using different approaches and methods. A good starting point is to follow resources such as the Data Visualisation Catalogue to identify the most appropriate chart type for the data and the story you want to communicate.
To understand the potential and capabilities of Echarts library, it is also useful to explore the examples and configuration options provided in its documentation. For example, the ECharts option reference provides a comprehensive overview of available components, layouts, and visualisation techniques.
The first step is to sketch, design, and prototype dashboard layouts before implementation. Tools such as Penpot or Figma support collaborative design workflows, although a simple pen and paper can often be enough to develop initial ideas.
Once the design is defined, it can be rapidly implemented, prototyped and shared using the ECharts Editor for fast iteration.
For this workshop, the result visualisation is described at this link
The dashboard module is organised into two main sections. The first section manages the initialisation of textures, materials, and ECharts instances. The second section consists of a single update method that refreshes the dashboard by passing new values to the appropriate visual components.
- create the dashboard in a separate file
dashboard.js
import * as echarts from "echarts";

import {DynamicTexture} from "@babylonjs/core/Materials/Textures/dynamicTexture";

import {StandardMaterial} from "@babylonjs/core/Materials/standardMaterial";

import {MeshBuilder} from "@babylonjs/core/Meshes/meshBuilder";

import {Color3} from "@babylonjs/core/Maths/math.color";

export class Dashboard {

    constructor(scene, parent) {

        this.scene = scene;

        // Off-screen canvas used by ECharts to render the dashboard
        this.canvas = document.createElement("canvas");
        this.canvas.width = 1024;
        this.canvas.height = 512;

        // Initialise the ECharts instance using the off-screen canvas just created
        this.chart = echarts.init(this.canvas);

        // Babylon.js dynamic texture that will display the chart
        // The texture matches the canvas resolution to preserve quality
        this.texture = new DynamicTexture(
            "dashboardTexture",
            {
                width: 1024,
                height: 512
            },
            scene,
            false
        );

        // Material used to display the dashboard texture
        const material = new StandardMaterial("dashboardMaterial",scene);
        material.diffuseTexture = this.texture;
        material.diffuseTexture.hasAlpha = true; //Enable transparency for rounded or curved dashboard borders
        material.emissiveColor = Color3.White(); //Render the texture at full brightness, independent of scene lighting
        material.disableLighting = true; //Disable lighting calculations to avoid reflections and shading effects
        material.backFaceCulling = false; //Render both sides of the dashboard plane

        //Create the plane that acts as the dashboard surface
        this.plane = MeshBuilder.CreatePlane("dashboardPlane",
            {
                width: 0.20,
                height: 0.10
            },
            scene
        );

        //Attach the dashboard to the AR anchor or parent object
        this.plane.parent = parent;
        // Apply the dashboard material to the plane
        this.plane.material = material;


        // Initialise the dashboard with placeholder values
        // until live data becomes available
        this.update({
            bridgeName: "Waiting...",
            time: "--:--",
            air_temperature: 0,
            relative_humidity: 0,
            pm10: 0,
            level_cm: 0,
        });
    }

// Updates the dashboard contents using the latest data
    update(data) {  };

}
- The definition of the charts, created in the ECharts Editor, will then need to be added, together with all the variables, inside the
update(data)function
update(data) {

//Variables to control the position of the isual elements
const W = 1024;
const H = 512;
const RADIUS = 30;
const HEADER = 60;
const PAD = 20;

//Size of the individual cards
const innerW = W - PAD * 3;
const innerH = H - HEADER - PAD * 3;

const cardW = innerW / 2;
const cardH = innerH / 2;

//Rule colour for the PM10 values
const level = data.pm10 < 20 ? 'good' : data.pm10 < 50 ? 'moderate' : 'poor';
const green = level === 'good' ? '#22C55E' : '#D1D5DB';
const amber = level === 'moderate' ? '#F59E0B' : '#D1D5DB';
const red = level === 'poor' ? '#EF4444' : '#D1D5DB';

const option = {
  //Text and structure of the dashboard are withing this `grapich[]`
  graphic: [
    {
      type: 'group',
      id: 'dashboard',
      width: W,
      height: H,
      children: [
        {
          type: 'rect',
          id: 'backgroundDashboard',
          shape: {
            width: W,
            height: H,
            r: RADIUS
          },
          style: {
            fill: '#111827'
          }
        },

        {
          type: 'text',
          id: 'time',
          right: PAD,
          top: PAD,
          style: {
            text: `Updated ${data.time}`,
            font: 'bold 28px sans-serif',
            fill: '#F9FAFB'
          }
        },
        {
          type: 'text',
          id: 'bridgeName',
          left: PAD,
          top: PAD,

          style: {
            text: data.bridgeName,
            font: 'bold 28px sans-serif',
            fill: '#F9FAFB'
          }
        },
        {
          type: 'line',
          id: 'lineSep',
          shape: {
            x1: 0,
            y1: HEADER,
            x2: W,
            y2: HEADER
          },
          style: {
            lineWidth: 2,
            stroke: '#fff'
          }
        },

        //
        // TEMPERATURE CARD
        //
        {
          type: 'group',
          id: 'TEMPERATURE CARD',
          children: [
            {
              type: 'rect',
              shape: {
                x: PAD,
                y: HEADER + PAD,
                width: cardW,
                height: cardH,
                r: 20
              },
              style: {
                fill: '#1F2937'
              }
            },

            // Temperature label
            {
              type: 'text',
              left: PAD * 2,
              top: 100,
              style: {
                text: '🌡️ AIR TEMPERATURE',
                font: 'bold 17px sans-serif',
                fill: '#D1D5DB'
              }
            },

            // Temperature description
            {
              type: 'text',
              left: PAD * 4,
              top: 120,
              style: {
                text: 'Current temperature',
                font: '15px sans-serif',
                fill: '#6B7280'
              }
            },

            // Temperature value
            {
              type: 'text',
              left: PAD * 15,
              top: 180,
              style: {
                text: `${Number(data.air_temperature).toFixed(1)} °C`,
                font: 'bold 44px sans-serif',
                fill:
                  Number(data.air_temperature ?? 0) < 0
                    ? '#60A5FA'
                    : Number(data.air_temperature ?? 0) < 10
                    ? '#38BDF8'
                    : Number(data.air_temperature ?? 0) < 20
                    ? '#22C55E'
                    : Number(data.air_temperature ?? 0) < 30
                    ? '#F59E0B'
                    : '#EF4444'
              }
            }
          ]
        },

        //
        // HUMIDITY CARD
        //
        {
          type: 'group',
          id: 'HUMIDITY CARD',
          children: [
            {
              type: 'rect',
              shape: {
                x: PAD * 2 + cardW,
                y: HEADER + PAD,
                width: cardW,
                height: cardH,
                r: 20
              },
              style: {
                fill: '#1F2937'
              }
            },
            // Humidity label
            {
              type: 'text',
              left: PAD * 3 + cardW,
              top: 100,
              style: {
                text: '💧️ RELATIVE HUMIDITY',
                font: 'bold 17px sans-serif',
                fill: '#D1D5DB'
              }
            },

            // Humidity description
            {
              type: 'text',
              left: PAD * 5 + cardW,
              top: 120,
              style: {
                text: 'Current Humidity',
                font: '15px sans-serif',
                fill: '#6B7280'
              }
            }
          ]
        },

        // PM10
        {
          type: 'group',
          children: [
            {
              type: 'rect',
              shape: {
                x: PAD,
                y: HEADER + PAD * 2 + cardH,
                width: cardW,
                height: cardH,
                r: 20
              },
              style: {
                fill: '#1F2937'
              }
            },

            // PM10 label
            {
              type: 'text',
              left: PAD * 2,
              top: cardH + PAD + 100,
              style: {
                text: '🚦 PM10',
                font: 'bold 17px sans-serif',
                fill: '#D1D5DB'
              }
            },

            // PM10 description
            {
              type: 'text',
              left: PAD * 4,
              top: cardH + PAD + 120,
              style: {
                text: 'Airborne particulate matter',
                font: '15px sans-serif',
                fill: '#6B7280'
              }
            },

            // Green light
            {
              type: 'circle',
              left: PAD * 15,
              top: cardH + PAD + 150,
              shape: { r: 12 },
              style: { fill: green }
            },

            // Amber light
            {
              type: 'circle',
              left: PAD * 15,
              top: cardH + PAD + 180,
              shape: { r: 12 },
              style: { fill: amber }
            },

            // Red light
            {
              type: 'circle',
              left: PAD * 15,
              top: cardH + PAD + 210,
              shape: { r: 12 },
              style: { fill: red }
            },

            // Value
            {
              type: 'text',
              left: PAD * 17,
              top: cardH + PAD + 180,
              style: {
                text: `${data.pm10} μg/m³`,
                font: 'bold 28px sans-serif',
                fill:
                  data.pm10 < 20
                    ? '#22C55E'
                    : data.pm10 < 50
                    ? '#F59E0B'
                    : '#EF4444'
              }
            }
          ]
        },

        //
        // WATER LEVEL
        //
        {
          type: 'group',
          id: 'WATER CARD',
          children: [
            {
              type: 'rect',
              shape: {
                x: PAD * 2 + cardW,
                y: HEADER + PAD * 2 + cardH,
                width: cardW,
                height: cardH,
                r: 20
              },
              style: {
                fill: '#1F2937'
              }
            },
            // Water-level label
            {
              type: 'text',
              left: PAD * 3 + cardW,
              top: cardH + PAD + 100,
              style: {
                text: '🌊 WATER LEVEL',
                font: 'bold 17px sans-serif',
                fill: '#D1D5DB'
              }
            },

            // Water-level description
            {
              type: 'text',
              left: PAD * 5 + cardW,
              top: cardH + PAD + 120,
              style: {
                text: 'Height below the bridge',
                font: '15px sans-serif',
                fill: '#6B7280'
              }
            }
          ]
        }
      ]
    }
  ],

  // CHARTS
  grid: {
    left: PAD * 8 + cardW, // x position
    top: HEADER + PAD * 7 + cardH, // y position
    width: 250, // bar area width
    height: 30 // bar area height
  },
  xAxis: {
    type: 'value',
    min: 0,
    max: 100,
    // Grid lines
    splitLine: {
        show: true,
        lineStyle: {
            color: '#444',  // change to any colour
            width: 1
        }
  }
},
  yAxis: {
    data: ['Water Height']
  },

  series: [
    // Humidity Gauge
    {
      type: 'gauge',
      center: [PAD * 20 + cardW, 195],
      radius: 100,
      min: 0,
      max: 100,

      progress: {
        show: true,
        width: 12
      },

      axisLine: {
        lineStyle: {
          width: 12,
          color: [
            [0.3, '#EF4444'],
            [0.7, '#F59E0B'],
            [1, '#38BDF8']
          ]
        }
      },

      detail: {
        color: '#38BDF8',
        fontSize: 18,
        formatter: '{value}%'
      },
      data: [
        {
          value: Number(data.relative_humidity ?? 0)
        }
      ]
    },

    //WATER height
    {
      type: 'bar',
      data: [data.level_cm],

      label: {
        show: true,
        position: 'right',
        formatter: '{c} cm',
        color: '#FFF',
        fontSize: 18,
        fontWeight: 'bold'
      },
      color: ['#38BDF8']
    }
  ]
};

// Apply the new ECharts configuration and force a full refresh
    this.chart.setOption(option, true);

// Get the Babylon.js texture rendering context
    const ctx = this.texture.getContext();

// Clear any previous image from the texture
    ctx.clearRect(0,0,this.canvas.width,this.canvas.height);

// Copy the updated ECharts canvas into the Babylon texture
    ctx.drawImage(this.canvas,0,0);
    this.texture.update();
}

}
We will reuse the existing createContent.js module to create the dashboard interface and handle the MQTT communication logic, including subscribing to and processing incoming messages.
- import both dashboard and MQTT controller modules on top of the file
import { Dashboard } from "./dashboard.js";
import { createMQTTController } from "./mqttController.js";
- Immediately after creating the
originModel, which will be used as the parent object for the dashboard components, add the dashboard initialization code
const dashboard = new Dashboard(scene, originModel);
- add after it the
mqttcontrollerwith the broker address
const mqttController = createMQTTController({brokerAddress: "MQTT.BROKER.ADDRESS"});
- And immediately after, the
subscribeToTopic()call and the function responsible for updating the dashboard. ThebridgeManager.getFeature()function is used to determine which is the closest bridge, and therefore sensors and MQTT topics should be monitored.
 mqttController.subscribeToTopic("TOPIC/TO/SUBSCRIBE",(topic, payload) => {
        const activeBridge =bridgeManager.getFeature(bridgeManager.activeFeature);
        // No bridge is currently active
        if (!activeBridge) {
            dashboard.update({
                bridgeName: "Waiting...",
                time: "--:--",
                air_temperature: 0,
                relative_humidity: 0,
                pm10: 0,
                level_cm: 0,
            });
            return;
        }

        // An active bridge is available
        const data = JSON.parse(payload);

        dashboard.update({
            bridgeName: activeBridge.properties.name,
            time: data.time ?? "--:--",
            air_temperature:data.air_temperature ?? 0,
            relative_humidity:data.relative_humidity ?? 0,
            pm10:data.pm10 ?? 0,
            level_cm:data.level_cm ?? 0,
        });
    }
As in the previous example, the dashboard will only be visible when the marker is in view. Therefore, in imageTargetPipeline.js, make sure that within the if (event.name === "target-image") block, the originModel is enabled or disabled depending on whether the target image has been found (onXrImageFoundObservable) or lost (onXrImageLostObservable).
Also ensure that the update function (onXrImageFoundObservable) contains references to the position, rotation, and scale of the originModel, so that the dashboard correctly follows the tracked image and remains aligned with the marker.
// Move the content to the tracked image position
originModel.position.set(
    event.position.x,
    event.position.y,
    event.position.z
);

// Create a quaternion before applying the tracked rotation
originModel.rotationQuaternion ??= new Quaternion();

originModel.rotationQuaternion.set(
    event.rotation.x,
    event.rotation.y,
    event.rotation.z,
    event.rotation.w
);

// Scale the content relative to the physical image target
originModel.scaling.set(3, 3, 3);
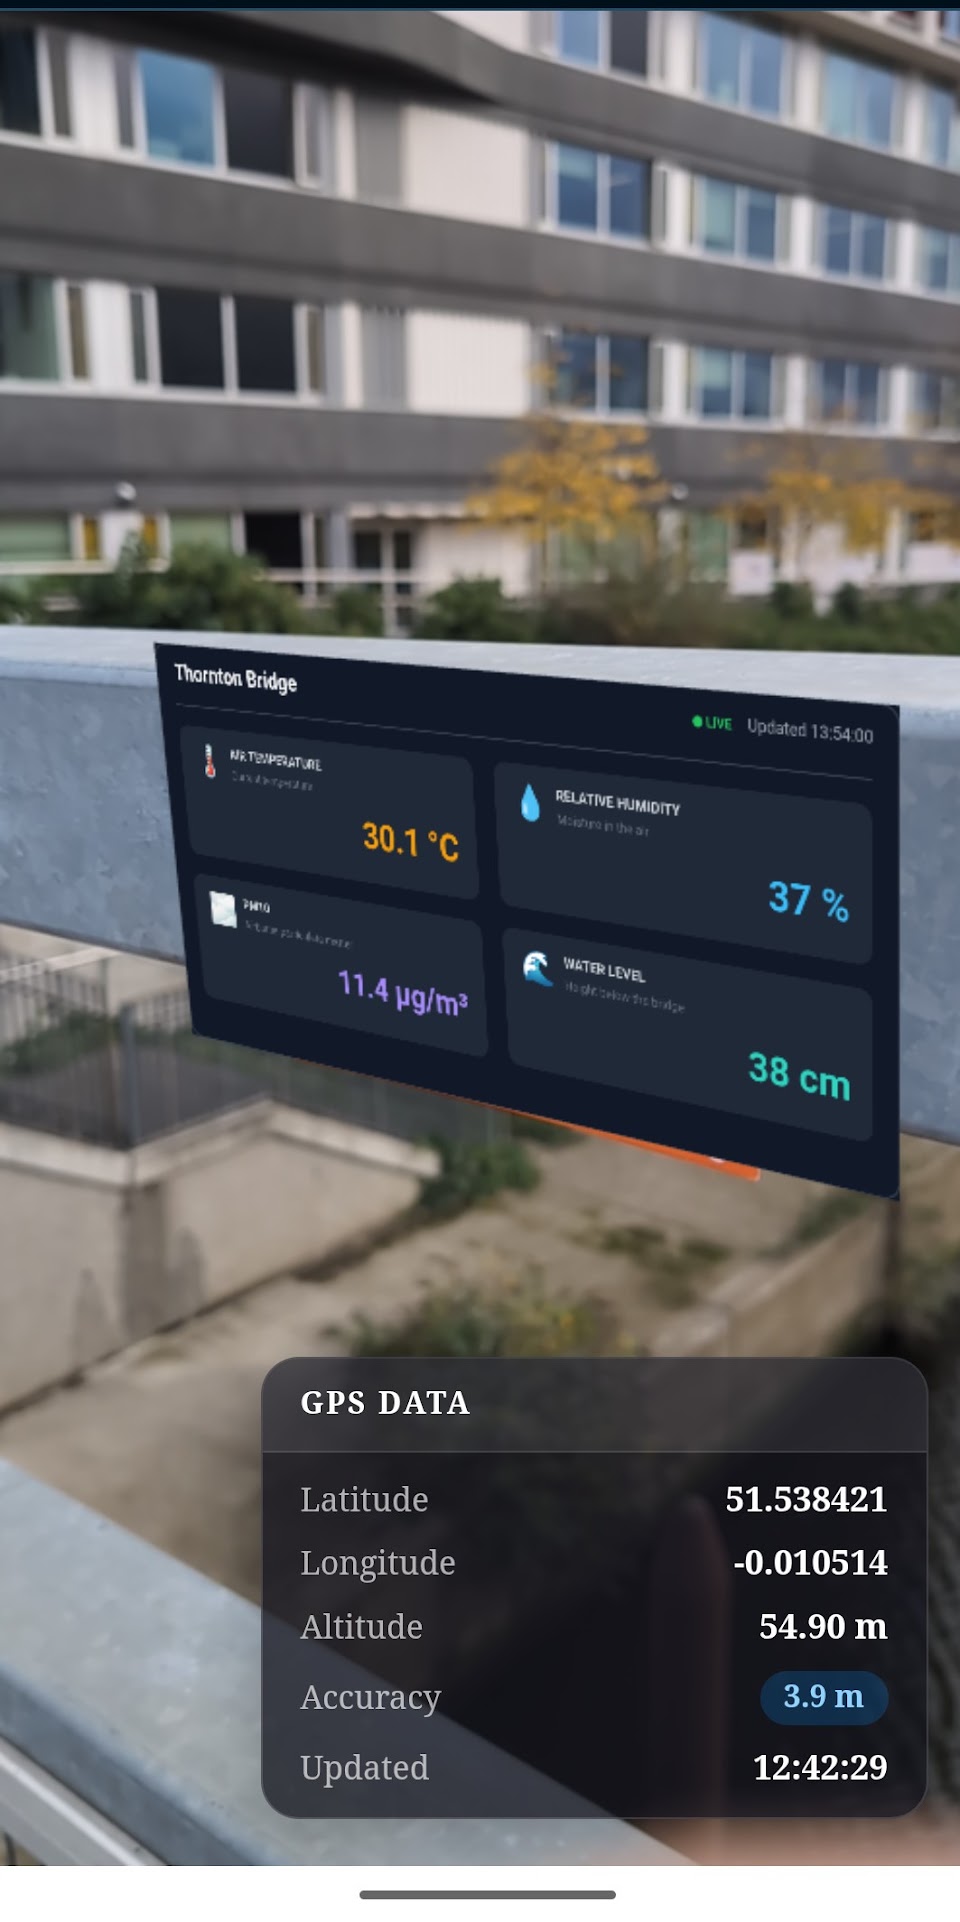
So far, the project has been tested in development mode. Before making it available on GitHub Pages or another web server, we need to create a production build.
The simplest option is to generate a standard deployment package.
- First, stop the local development server by pressing
Ctrl+Con Windows orOption+Con macOS, then run:
npm run build
Vite.js will create a new folder named dist containing all the files required by the application. During this process, dependencies are bundled, unused code is removed where possible, and assets are optimised to improve performance and reduce file size.
- to see the preview of the built app in the Terminal use
npm run previewor use any other local server pointing at thedistfolder.
PWA
An alternative is to package the project as a Progressive Web App (PWA). In addition to the standard website functionality, a PWA can be installed on desktop and mobile devices, work offline by caching assets locally, and provide a more application-like experience. This can be particularly useful for this case, where large assets such as models, textures, and supporting files can be stored locally and reused across sessions.
To function as a Progressive Web App (PWA), a website requires three main components:
- A Web App Manifest (
manifest.json), which describes the application, including its name, icons, theme colours, and how it should behave when installed. - A Service Worker (
sw.js), a background script that can cache files, enable offline access, and manage updates. - A secure deployment (HTTPS), which is required by modern browsers for service workers to operate.
The manifest defines how the application appears to users when installed on a desktop or mobile device.
The service worker runs separately from the main application and intercepts network requests. This allows assets such as JavaScript files, stylesheets, images, and 3D models to be stored locally and reused on subsequent visits, reducing loading times and enabling offline operation.
As we are using Vite.js, the easiest way to add PWA support is by using the Vite PWA Plugin.
- As usual, install the package using:
npm i vite-plugin-pwa
If it does not already exist, create a new file named vite.config.js in the root of the project. This file is used to configure Vite and add additional plugins such as PWA support.
import { defineConfig } from "vite";
import { VitePWA } from "vite-plugin-pwa";

export default defineConfig({
    build:{target:"esnext"},  //needed to address just moder browsers
    plugins: [
        VitePWA({
            registerType: "autoUpdate",

            manifest: {
                name: "NAME OF THE PROJECT",
                short_name: "SHORT NAME",
                description: "DESCRIPTION IN ONE SENTENCE",
                theme_color: "#121212",
                background_color: "#121212",
                display: "standalone",

                icons: [
                    {
                        src: "img/icon/ICON.png",
                        sizes: "192x192",
                        type: "image/png"
                    },
                    {
                        src: "img/icon/ICON.png",
                        sizes: "512x512",
                        type: "image/png"
                    }
                ]
            },

            workbox: {
                maximumFileSizeToCacheInBytes: 10 * 1024 * 1024, //for larger built
                globPatterns: [
                    "**/*.{js,css,html,png,svg,glb}" //the filetype to store in the cache
                ]
            }
        })
    ]
});
In index.js, add the following import at the very top of the file:
import { registerSW } from "virtual:pwa-register";
registerSW({
    immediate: true
});
- Finally, to build the WebApp, as before, run
npm run build
- and when ready, to view the result run
npm run preview
Vite.js will start a local server (note that the port number may be different from the one used during development).
If the PWA has been configured correctly, an Install App icon should appear next to the browser address bar. Alternatively, the installation option can usually be found under the browser menu (often under More Tools or Install App).

Deploying on GitHub Pages and Other WebServer
When developing locally, ViteJS serves the application from the root path (/), however, when the app is deployed through GitHub Pages, or other webservers, it may be hosted either at the domain root or within a subdirectory.
- In case the app is serve by the root directory, such as
https://[USERNAME].github.io/, or to a custom domain (e.g.www.example.com) there is nothing to change, asViteJSconsider the root path/. - If the app is deployed to
https://[USERNAME].github.io/[REPOSITORY]/(e.g. the repository is at https://github.com/[USERNAME]/[REPOSITORY]), then invite.config.jswe need to change the path accordingly using the variablebaseset to/[REPOSITORY]/.
export default defineConfig({
  build: {
    target: 'esnext'
  },

base:'/NAME_OF_THE_REPOSITORY/',
  plugins: [
    [REST OF THE CODE]
Geofencing areas
Using TurfJS and GeoJSON.io, provides area-based activation instead of a distance buffer.
Charts and data visualisation
Starting from the existing charts configuration, provide alternative chart layouts