This Workshop is OUTDATED
This workshop will show you how to:
- create a 3D web map using Harp.GL
- import and visualise GeoJson data on Harp.GL using 2D and 3D POI elements
- query and interact with the map's features
To complete this workshop you will need:
- Visual Studio Code (or other text editor)
- Live Server for VS Code (or other local server)
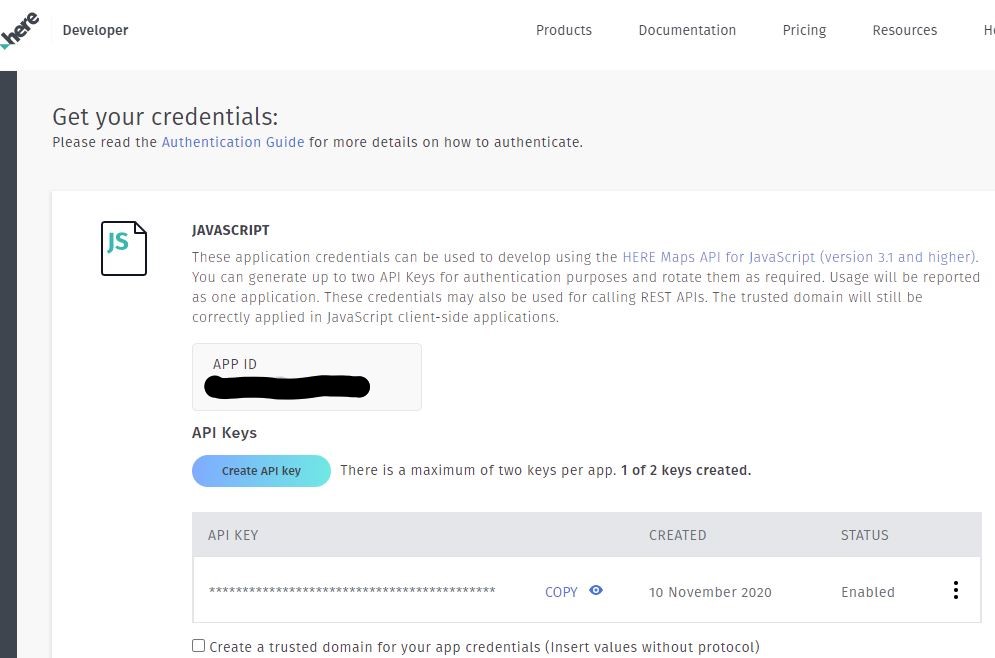
- HERE Developer Credential, Freemium plan to obtain the Javascript API Key
Resources and Geodata
Languages used:
- HTML
- JavaScript
A basic HarpGL map can be created using few lines of code. Setup a Visual Studio Code work space by adding your project's folder, and ensure that the Live Server extension is installed, View -> Extensions or Ctrl+Shift+X.
In VSCode create a new file named index.html, and within the tags head
- add the ThreeJS library
- add the HarpGL library
<!--ThreeJS-->
    <script src="https://unpkg.com/three/build/three.min.js"></script>
<!--HarpGL-->
    <script src="https://unpkg.com/@here/harp.gl/dist/harp.js"></script>
- Add definition of the
style, or link the externalcss
<style>
    body {
        background: #fff;
        padding: 0;
        margin: 0;
        font-weight: bold;
        overflow: hidden;
    }

    #mapCanvas {
        position: absolute;
        border: 0px;
        left: 0px;
        width: 100%;
        height: 100%;
        overflow: hidden;
        z-index: -1;
    }

    #copyrightNotice {
        position: absolute;
        right: 0;
        bottom: 0;
        background-color: #f0fef1;
        z-index: 100;
        padding: 2px 5px;
        font-family: sans-serif;
        font-size: 0.8em;
        font-weight: normal;
    }
</style>
Finally, within the tags body create:
- a tag
canvas, where the map is going to be displayed - and the JavaScript file
script src="js/index.js"used to control the visualisation of the map.
In this example there is also a div of the copyrightNotice, a small label at the bottom right corner of the website.
<body>
    <canvas id="mapCanvas"></canvas>

    <div id="copyrightNotice"></div>

    <script src="js/index.js"></script>
</body>
The final index.html, with some additional metadata, should look like this
<!DOCTYPE html>
<html lang="en">
    <head>
        <meta charset="UTF-8" />
        <meta name="viewport" content="width=device-width, user-scalable=no, minimum-scale=1.0, maximum-scale=1.0"  />
        <meta http-equiv="X-UA-Compatible" content="ie=edge" />
        <title>Harp.gl - Hello World</title>

        <!--ThreeJS-->
        <script src="https://unpkg.com/three/build/three.min.js"></script>
        <!--HarpGL-->
        <script src="https://unpkg.com/@here/harp.gl/dist/harp.js"></script>

        <style>
            body {
                background: #fff;
                padding: 0;
                margin: 0;
                font-weight: bold;
                overflow: hidden;
            }

            #mapCanvas {
                position: absolute;
                border: 0px;
                left: 0px;
                width: 100%;
                height: 100%;
                overflow: hidden;
                z-index: -1;
            }

            #copyrightNotice {
                position: absolute;
                right: 0;
                bottom: 0;
                background-color: #f0fef1;
                z-index: 100;
                padding: 2px 5px;
                font-family: sans-serif;
                font-size: 0.8em;
                font-weight: normal;
            }
        </style>
    </head>
    <body>

        <canvas id="mapCanvas"></canvas>
        <div id="copyrightNotice"></div>
        <script src="js/index.js"></script>

    </body>
</html>
As mentioned above, the index.js is used to control the content of the canvas in the index.html
- create a new
index.js - as first element, add a new constant to reference the
canvasin theindex.html
//the HTML element that is holding the mapView
const canvas = document.getElementById("mapCanvas");
- set the target of the map, in this example, latitude and longitude of New York City
// Look at New York.
   const NY = new harp.GeoCoordinates(40.707, -74.01);
To link HarpGl to the canvas we use the MapView object
- the
canvasis the reference to theindex.html - the property
themeis used to define how the map will look like - the
targetis the centre of theMapView tilt,headingandzoomLevelare used to setup the standard camera of the map
//Style of the map
   const map = new harp.MapView({
            canvas,
            theme: "https://unpkg.com/@here/harp-map-theme/resources/berlin_tilezen_base.json",
            target: NY,
            tilt: 50,
            heading: -20,
            zoomLevel: 16.1
            });
The map has a standard control system. It is possible to add a MapControlsUI as well.
//basic control of the map
   const mapControls = new harp.MapControls(map);
         mapControls.maxTiltAngle = 50;

   const ui = new harp.MapControlsUI(mapControls, { zoomLevel: "input" }); //zoomLevel: "input" shows the level of zoom on the map
         canvas.parentElement.appendChild(ui.domElement);
We then prepare the Copyright information that need to be added to the map
//the copyright label
   harp.CopyrightElementHandler.install("copyrightNotice", map);
   const hereCopyrightInfo = {
               id: "here.com",
               year: new Date().getFullYear(),
               label: "HERE",
               link: "https://legal.here.com/terms"
            };
   const copyrights = [hereCopyrightInfo];
and finally we can load the actual Vector Tiles.
//the vector tiles contain the 3D buidling. To be loaded a API key is needed
         const omvDataSource = new harp.VectorTileDataSource({
                baseUrl: "https://vector.hereapi.com/v2/vectortiles/base/mc",
                authenticationCode: "YOUR-API-KEY_from_Here",
                styleSetName: "tilezen",
                copyrightInfo: copyrights
            });

//add the MapView to the canvas
         map.addDataSource(omvDataSource);
Final touch, a function that update the view of the map if the browser is resized
//If the browser is resized, update the dimension of the map as well
         map.resize(window.innerWidth, window.innerHeight);
         window.addEventListener("resize", () => {
                map.resize(window.innerWidth, window.innerHeight);
            });
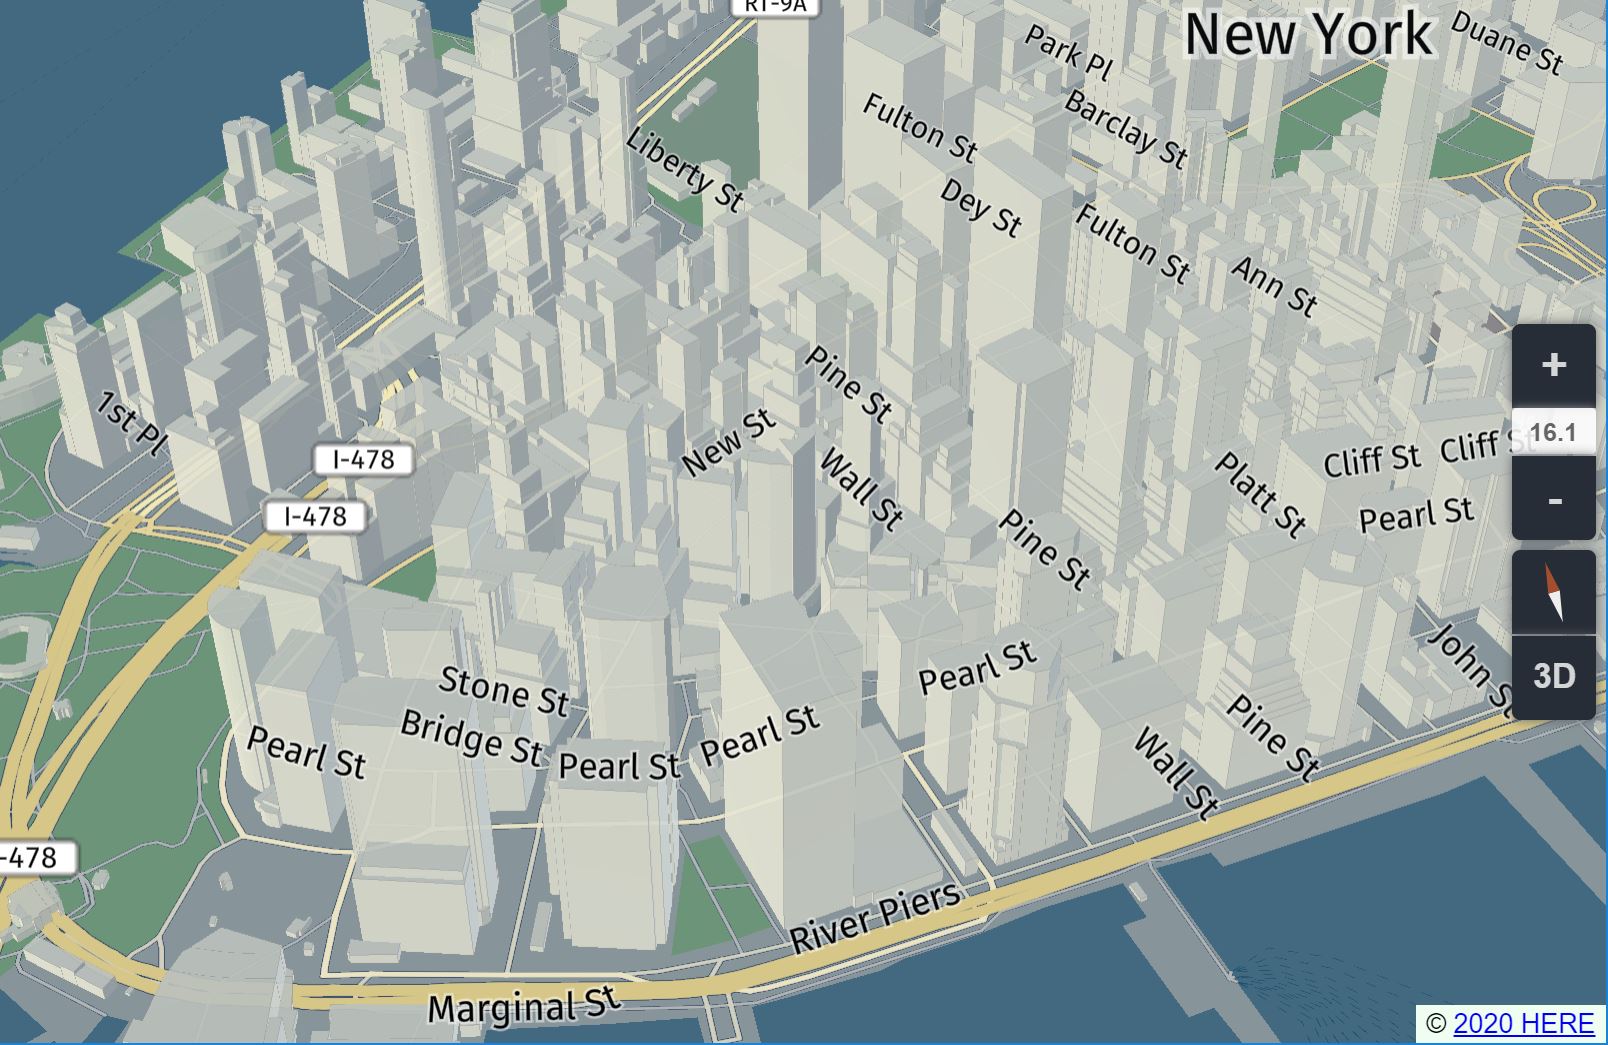
index.html and index.js provides this result
The location of the map can be changed via the property target of the MapView using additional GeoCoordinates(latitude, longitude) constant, for example
const paris = new harp.GeoCoordinates(48.858760, 2.294106);
const singapore = new harp.GeoCoordinates(1.278676, 103.850216);
the aspect of the map is controlled by the theme property of the MapView
https://unpkg.com/@here/harp-map-theme@latest/resources/berlin_derived.json
https://unpkg.com/@here/harp-map-theme@latest/resources/berlin_tilezen_base.json
https://unpkg.com/@here/harp-map-theme@latest/resources/berlin_tilezen_base_globe.json
https://unpkg.com/@here/harp-map-theme@latest/resources/berlin_tilezen_day_reduced.json
https://unpkg.com/@here/harp-map-theme@latest/resources/berlin_tilezen_night_reduced.json
https://unpkg.com/@here/harp-map-theme@latest/resources/berlin_tilezen_effects_outlines.json
https://unpkg.com/@here/harp-map-theme@latest/resources/berlin_tilezen_effects_streets.json
https://unpkg.com/@here/harp-map-theme@latest/resources/berlin_tilezen_roadshields.json
HarpGL can be used to easily visualise large dataset using the GeoJson fileformat.
- Download the location of the Singapore's wireless hotspots in the
resourcesfolder of your project - create a new JavaScript
asyncfunctiongetWirelessHotspotsinindex.js
async function getWirelessHotspots()
{
  [...]_
}
// Visualise location of Wireless hotspots in Singapore
async function getWirelessHotspots() {
   const res = await fetch("resources/wireless-hotspots/wireless-hotspots-geojson.geojson");
   const data = await res.json();
- create a new
GeoJsonDataProvideras constant nameddataProvider- first parameter is the unique name as
string - second parameter the parsed GeoJson, in this example the
constnameddata.
- first parameter is the unique name as
const dataProvider = new harp.GeoJsonDataProvider("wireless-hotspots", data);
the dataProvider is passed to a Vector Tile using the VectorTileDataSource and added to the MapView
   const geoJsonDataSource = new harp.VectorTileDataSource({
     dataProvider,
     name: "wireless-hotspots",
   });
   await map.addDataSource(geoJsonDataSource);
The dataset is now part of the map, however, to visualise the points of the GeoJson, we need to define a StyleSet
const styles= harp.StyleSet = [
    {
    "when": ["==", ["geometry-type"], "Point"],
    technique: "circles",
    renderOrder: 10000,
    color: "#FF0000",
    size: 15,
      },
   ];
   geoJsonDataSource.setStyleSet(styles);
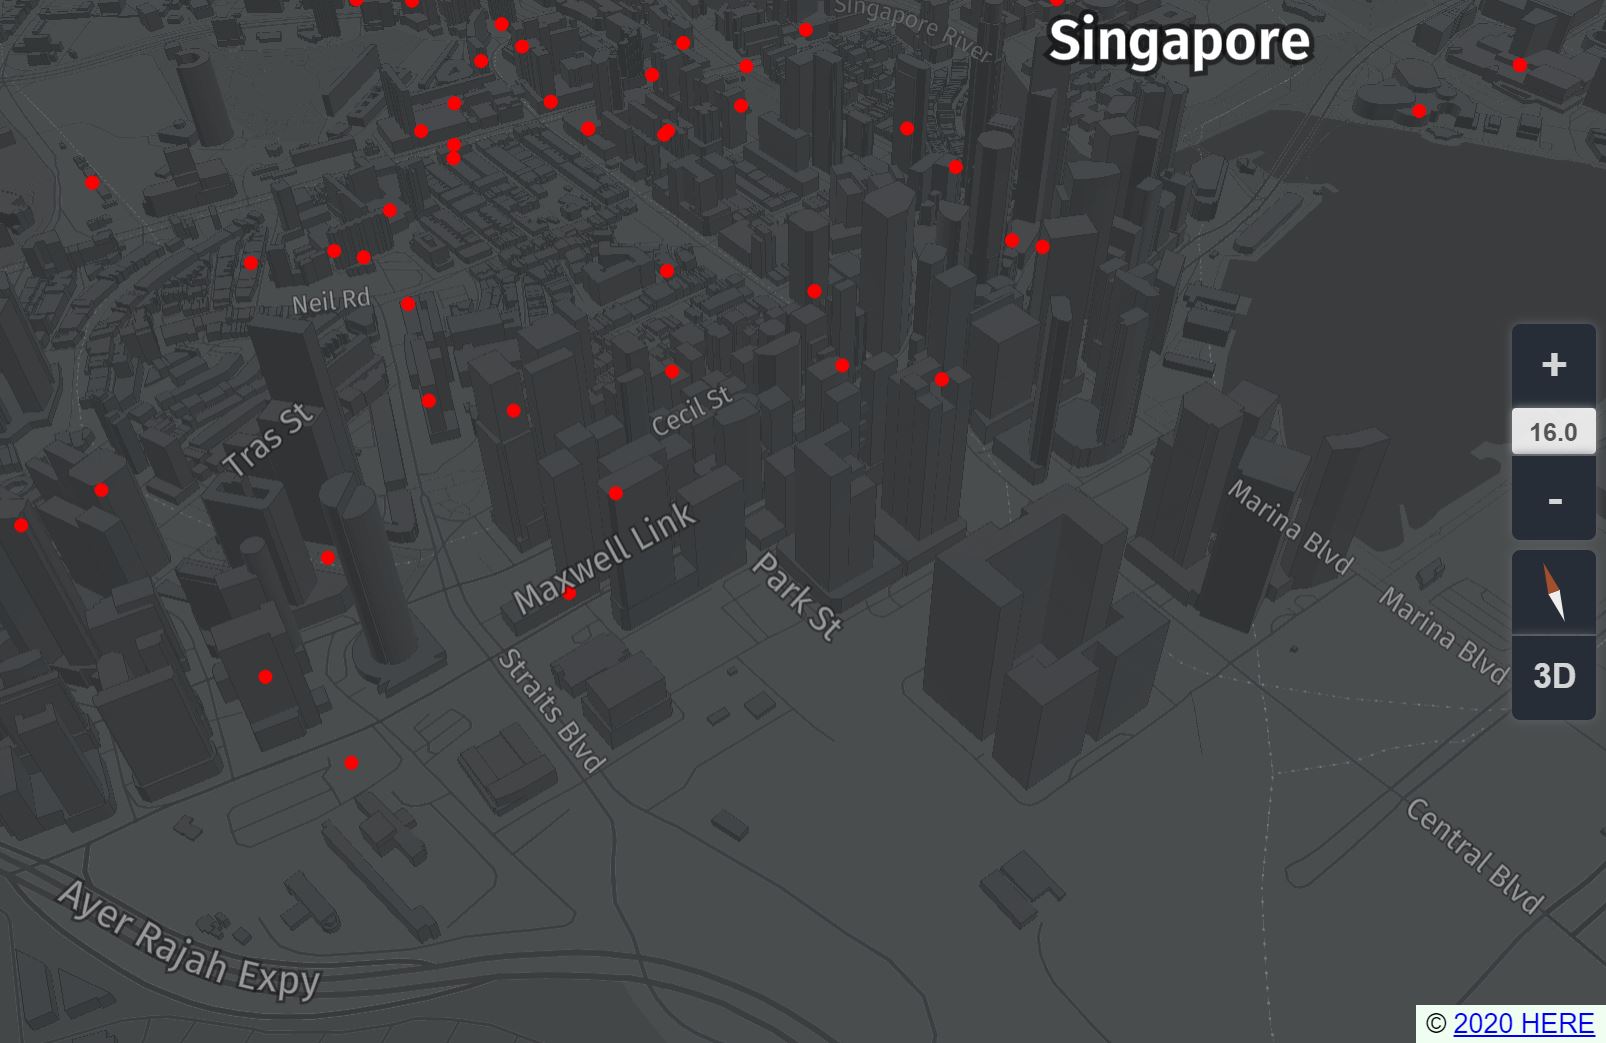
Target of the previous map was New York City. We can now set the new position of the map to Singapore
   //we can add the location at the beginning, in the MapView
   map.lookAt({
      target: new harp.GeoCoordinates(1.278676, 103.850216),
      tilt: 45,
      zoomLevel: 16,
   });
   map.update(); //the update() function ensure that the new target location is used
 }
- run the function after the
scriptusing
getWirelessHotspots();
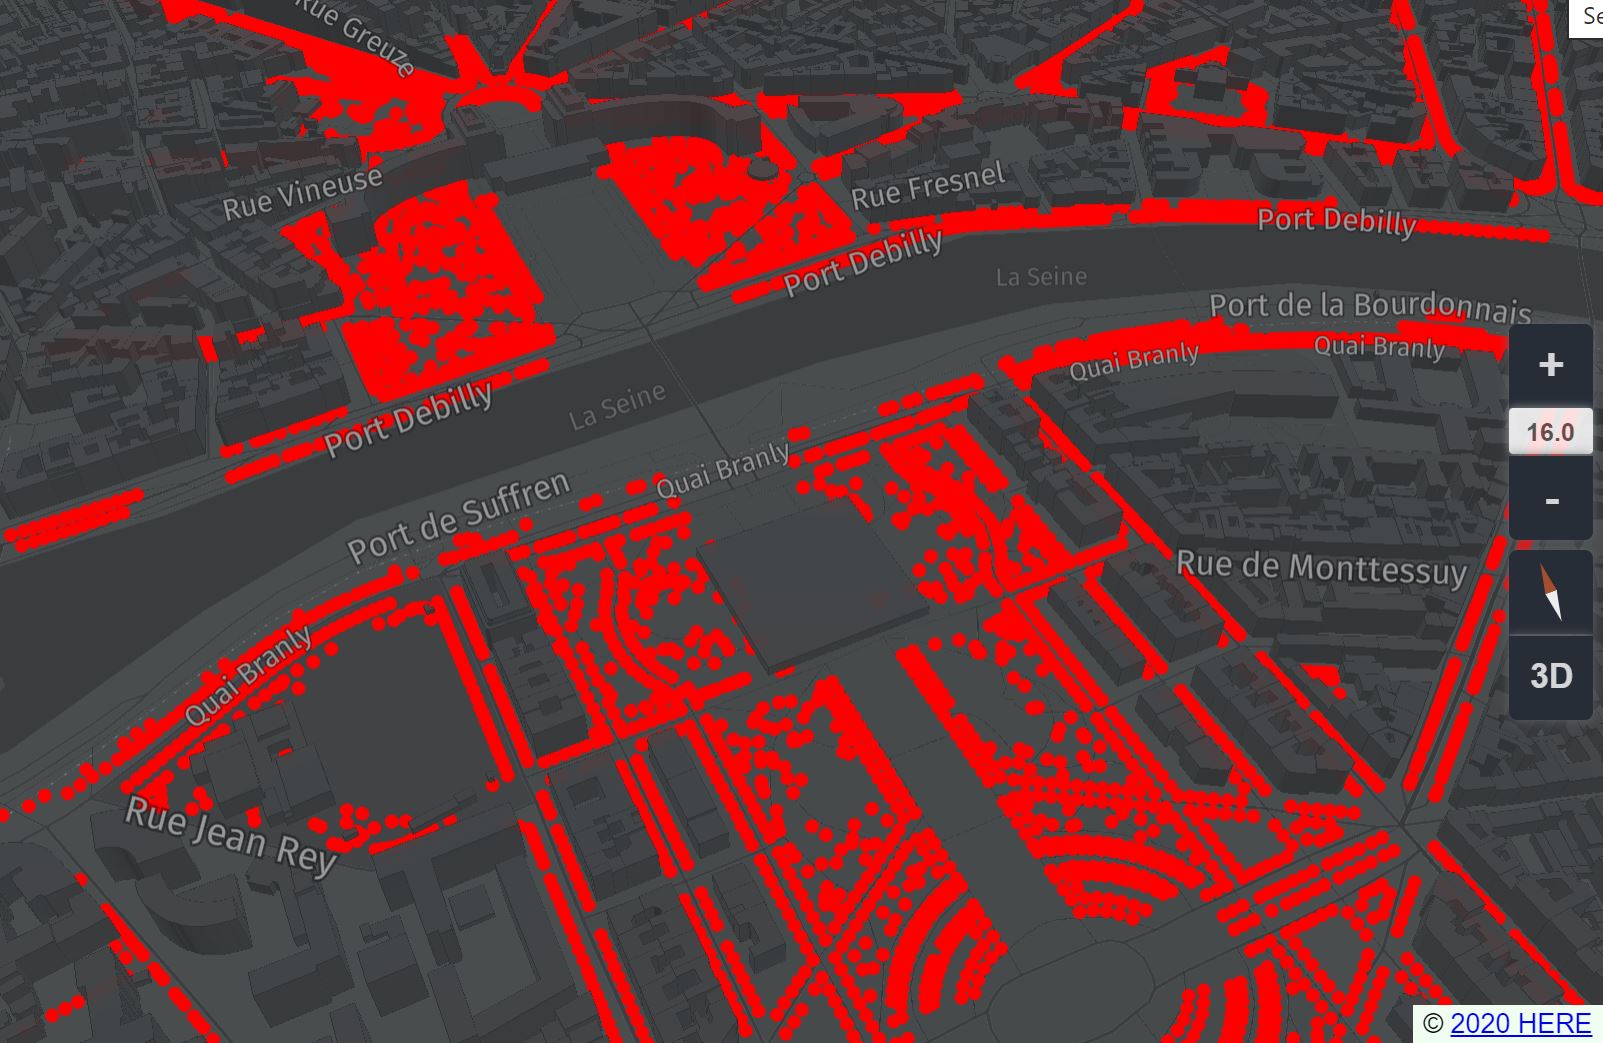
Before moving to the next part we are going to add a new dataset from Open Data Paris: all Paris' trees. As the type of data (Points) is similar to the wireless hotspots used before, we can copy and paste the entire getWirelessHotspots() function from index.js, and change its name in getTreesParis(). These are the changes we need to make
//const res = await fetch("resources/wireless-hotspots/wireless-hotspots-geojson.geojson");
const res = await fetch("resources/arbres/les-arbres.geojson");
[...]
//const dataProvider = new harp.GeoJsonDataProvider("wireless-hotspots", data);
const dataProvider = new harp.GeoJsonDataProvider("les-arbres", data);
[...]
//name: "wireless-hotspots",
name: "les-arbres",
[...]
//target: new harp.GeoCoordinates(1.278676, 103.850216),
target: new harp.GeoCoordinates(48.858760, 2.294106), //Paris
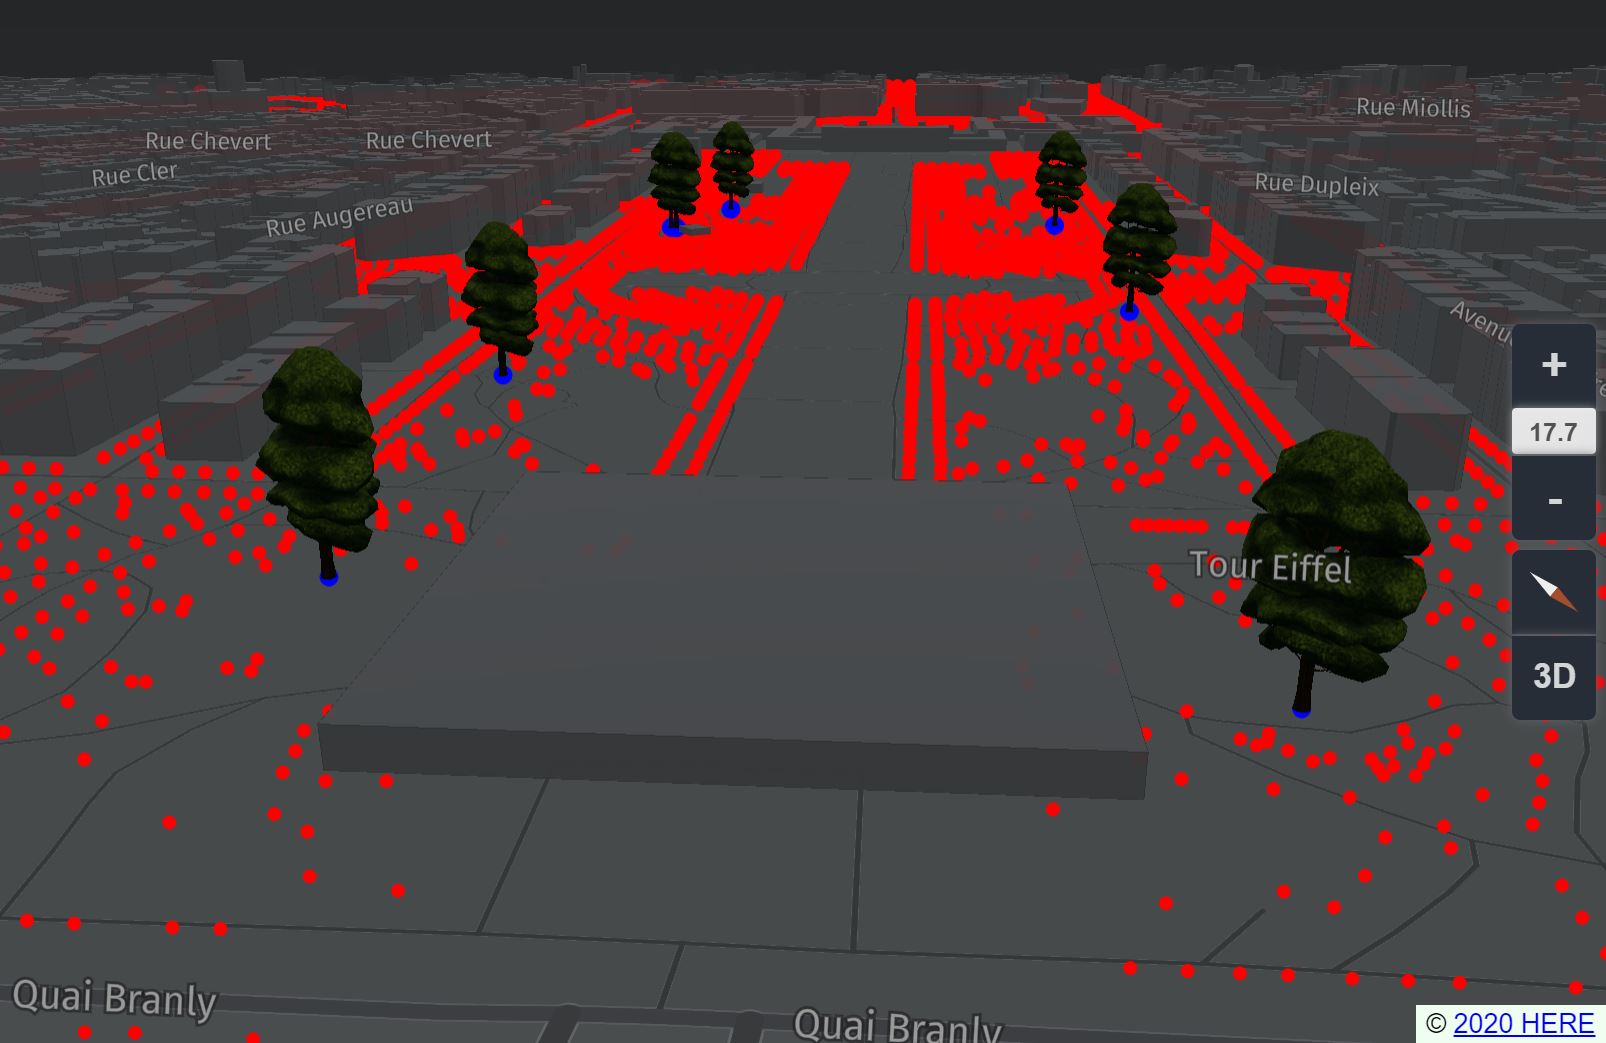
HarpGl is based on the ThreeJS framework. We can load 3D models and used them as labels for the GeoJson datasets. As we are going to use a GLTF model, we need to add, in the index.html the loader for the GLTF files.
<!--ThreeJS Loader GLTF-->
        <script src="https://cdn.rawgit.com/mrdoob/three.js/master/examples/js/loaders/GLTFLoader.js"></script>
In the index.js, just after the const canvas, we declare a new variable tree, we then create the new GLTFLoader and finally load the Tree90.glb.
var tree;
var loader = new THREE.GLTFLoader();
loader.crossOrigin = true;
loader.load('resources/arbres/Tree90.glb', function (data) {
    tree = data.scene;
    getTreesParis3D();
});
Once the model of the tree is loaded, the function getTreesParis3D() is executed. The first part is similar to the previous functions used to visualise the wireless hotspots and the trees
 //Visualise the location of 179 Arbres Remarquables in Paris
async function getTreesParis3D() {
   const res = await fetch("resources/arbres/arbresremarquablesparis.geojson");
   const data = await res.json();
   const dataProvider = new harp.GeoJsonDataProvider("Les Arbres Remarquables", data);
The second part is used to extract from the GeoJson dataser the location of each tree and create a clone of the 3D model we loaded in that position.
   dataProvider.input.features.forEach(el => {
   //console.log(el);
   let treecl=tree.clone(true);
      treecl.renderOrder = 10;
      treecl.scale.set(25,25,25);
      const geoPosition = new harp.GeoCoordinates(el.geometry.coordinates[1],el.geometry.coordinates[0]);
      treecl.anchor = geoPosition;

      map.mapAnchors.add(treecl);
      });

      const geoJsonDataSource = new harp.VectorTileDataSource({
      dataProvider,
      name: "Les Arbres Remarquables",
      });

      await map.addDataSource(geoJsonDataSource);
As in the previous examples, the points are also visualised with circles, this time blue
      const styles= harp.StyleSet = [
         {
         "when": ["==", ["geometry-type"], "Point"],
         technique: "circles",
         renderOrder: 1000,
         color: "#0000FF",
         size: 20,
         },
      ];
      geoJsonDataSource.setStyleSet(styles);
}
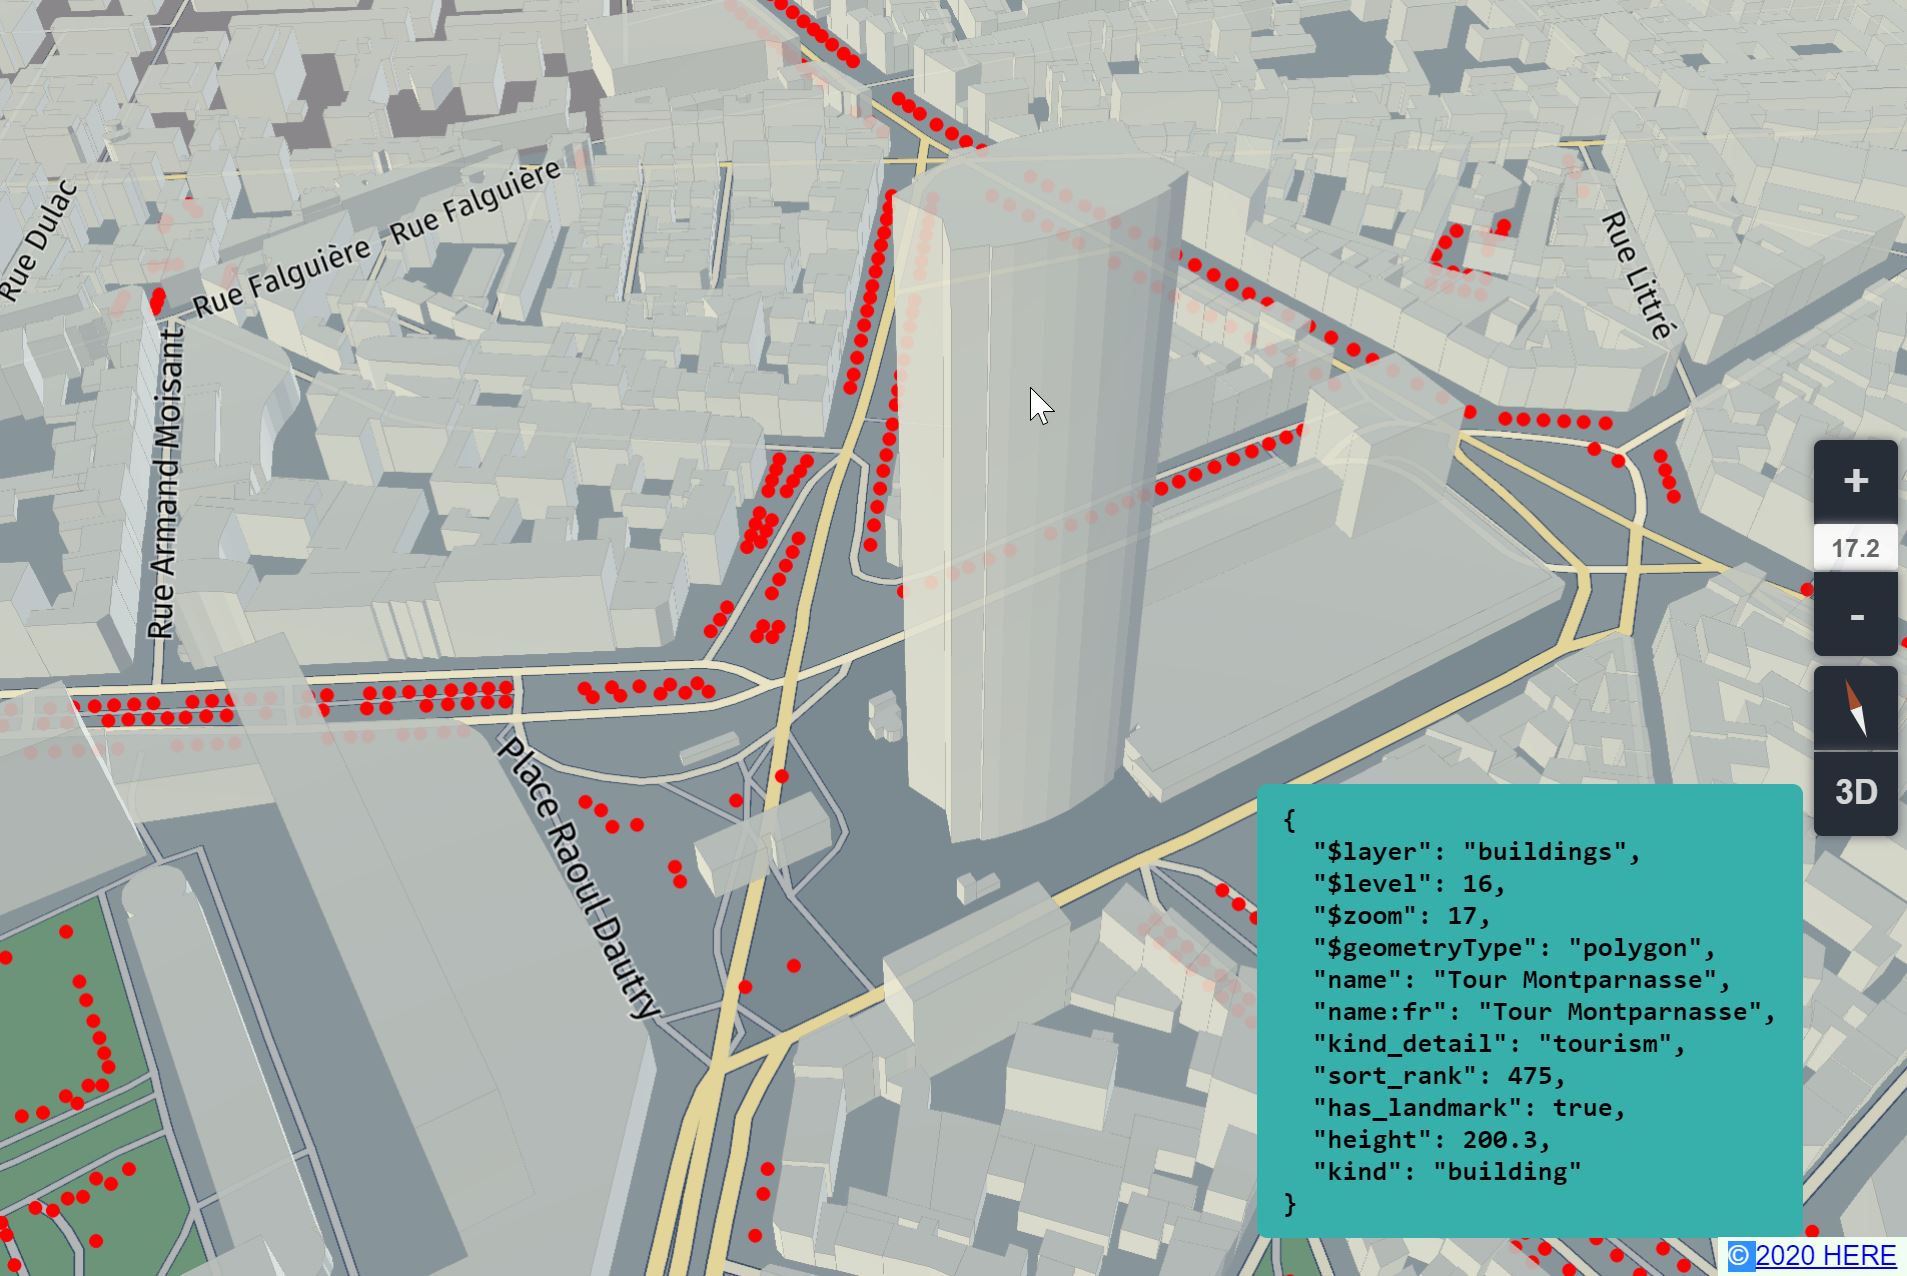
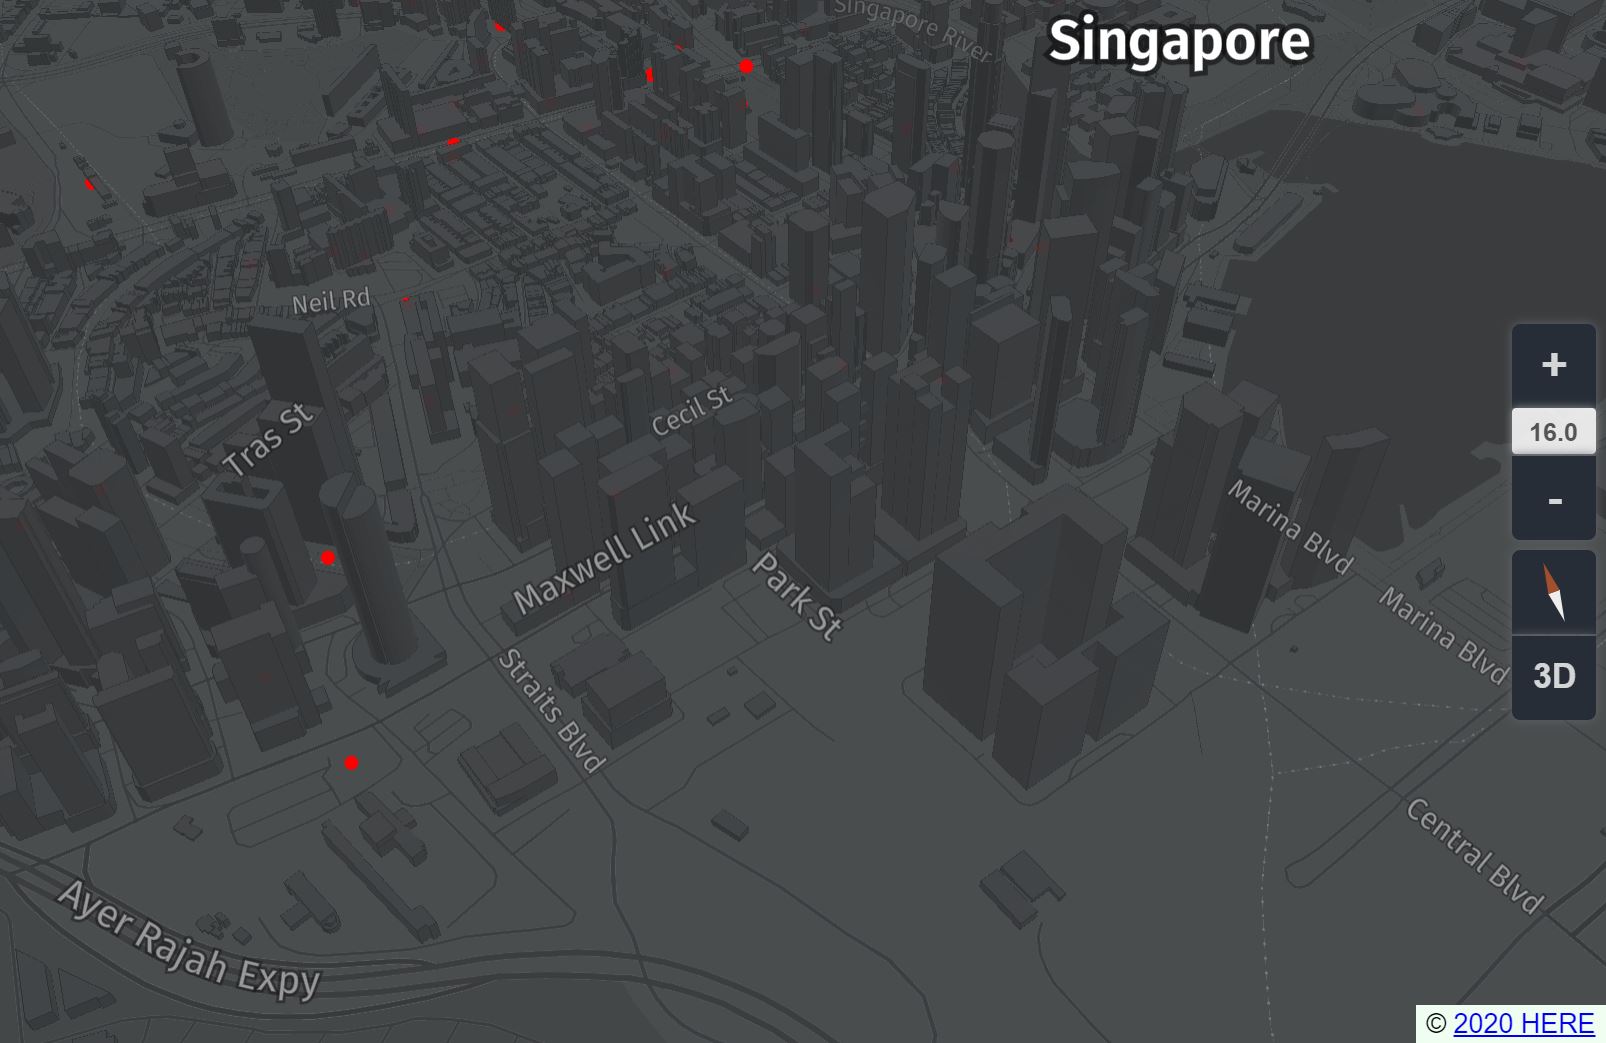
Step 4Map query
Both vector tiles and GeoJson datasets imported have their own properties. To visualise them we need to create a new function that detect the mouse click of the user. But before that, we need to declare in the MapView (using enablePickTechnique:true) and in the DataSource (using gatherFeatureAttributes: true) the possibility to select them.
const mapView = new harp.MapView({
   canvas,
   enablePickTechnique:true,
   theme: "https://unpkg.com/@here/harp-map-theme@latest/resources/berlin_tilezen_base.json"
});


const geoJsonDataSource = new harp.VectorTileDataSource({
     dataProvider,
     gatherFeatureAttributes: true,
     name: "les-arbres",
   });
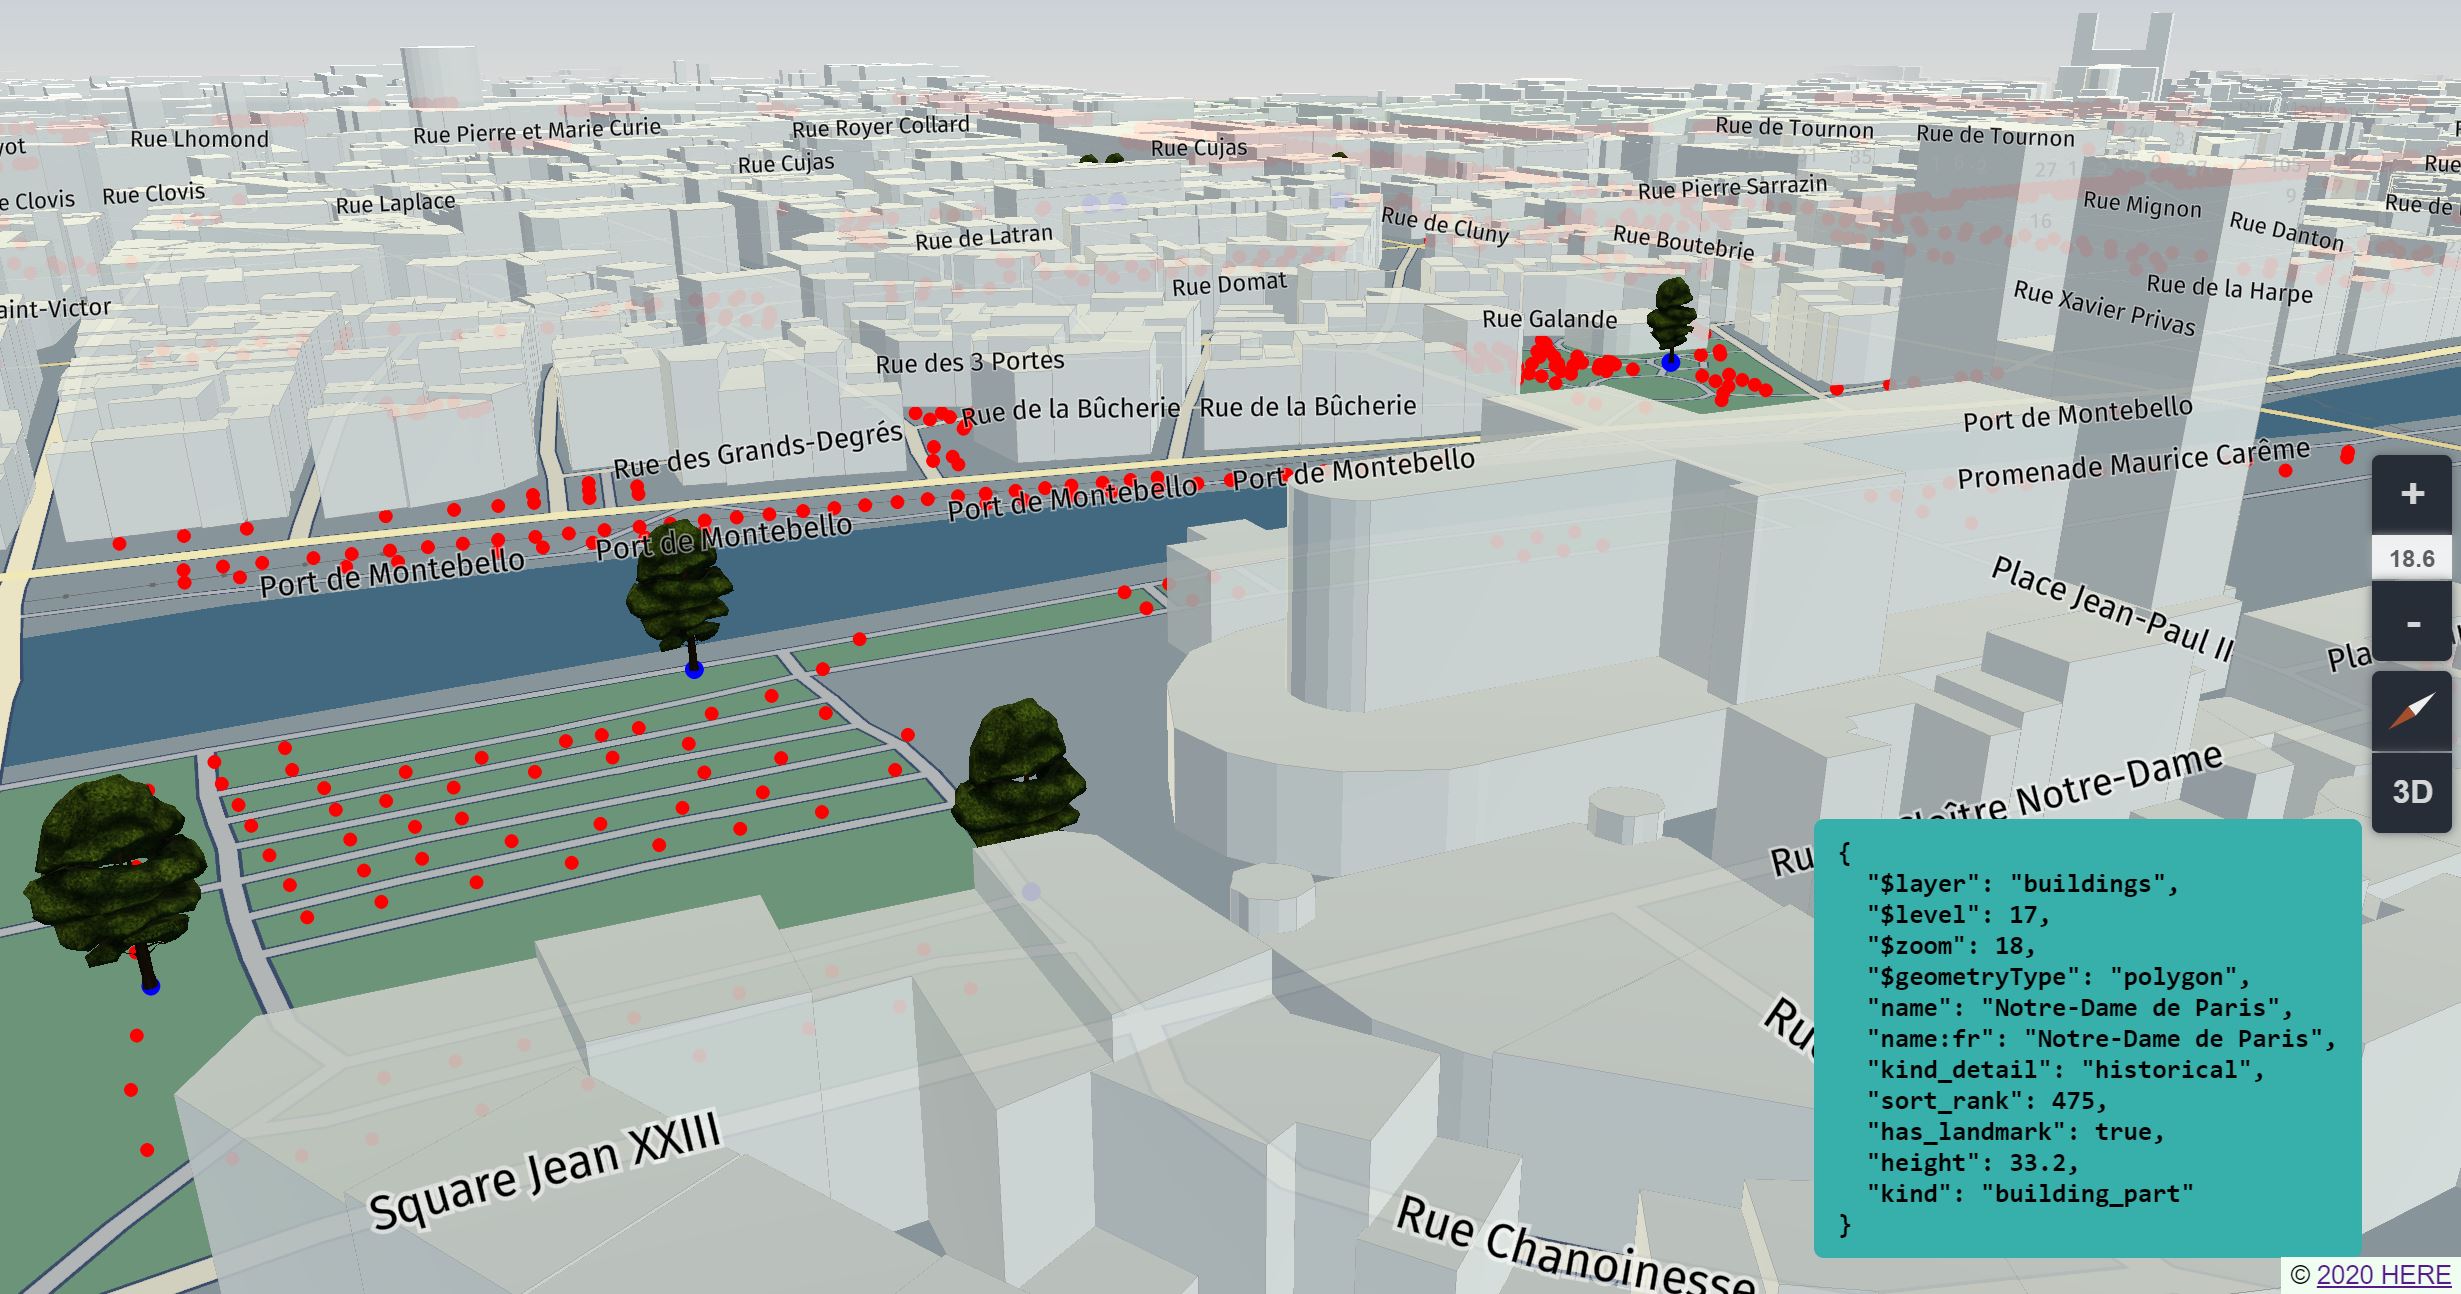
At the end of the index.js we add the function that listen to the user interaction (in this case a double click) and visualise the data on the page.
const element = document.getElementById("mouse-picked-result");
window.addEventListener("dbclick", (evt) => {
   var current;
  let usableIntersections =map.intersectMapObjects(evt.pageX, evt.pageY);
  if (usableIntersections.length > 1) {
      usableIntersections = usableIntersections.filter(item => item !== current);
  }
  if (usableIntersections.length === 0) {
      // Hide helper box
      element.style.visibility = "hidden";
      return;
  }
  // Get userData from the first result;
  current = usableIntersections[0];

  if (current.userData?.name !== undefined) {
     map.setDynamicProperty("selection", [current.userData.name]);
 }
 // Show helper box
 element.style.visibility = "visible";
 // Display userData inside of helper box
 element.innerText = JSON.stringify(current.userData, undefined, 2);
  console.log(current);
});
Final step is to create in the index.html the element mouse-picked-result
<body>
  <canvas id="mapCanvas"></canvas>

  <pre id="mouse-picked-result"></pre>

  <div id="copyrightNotice"></div>
  <script src="js/index01.js"></script>
</body>
with its own style
<style>

#mouse-picked-result{
                position:absolute;
                bottom:5px;
                border-radius: 5px;
                margin-left:10px;
                padding: 9px 12px;
                background: #37afaa;
                display: inline-block;
                visibility: hidden;
                text-align: left;
                right:50px;
            }
        </style>