Welcome
Welcome to Workshop 3 of Web Architecture. Today we're going to walk through the various different tools available to us in the browser to help us debug our application. Last week we started to see errors in our code and used the console to fix them. This week we will take this one step further and use the Developer tools inside our browser to explore issues within our websites, fix common errors and have a look ‘under the hood' to see what's going on behind the scenes.
Developer Tools in other Browsers
Most modern web browsers have some form of developer tools and will have many of the same tools available in the Chrome DevTools package. In this class we will focus on the Chrome browser but for completeness if you want to explore the other browsers then this is how you access the developer mode in other browsers.
- Chrome
- To open the developer console window on Chrome, use the keyboard shortcut
Ctrl-Shift-J(on Windows) orCommand-Option-J(on Mac). Alternatively, you can use the Chrome menu in the browser window, select the option "More Tools" and then select "Developer Tools."
- To open the developer console window on Chrome, use the keyboard shortcut
- Safari
- To open the Safari developer tools, select the Safari Menu > Preferences, and click on the Advanced Tab. Then check the box next to "Show Develop in the menu bar." Once you exit Preferences, you'll see a new Develop menu appear. Next, use Develop > Show Web Inspector to bring up the Developer tools.
- Firefox
- You can open the Firefox Developer Tools from the menu by selecting Tools > Web Developer > Toggle Tools or use the keyboard shortcut
Ctrl-Shift-IorF12on Windows and Linux, orCommand-Option-Jon macOS.
- You can open the Firefox Developer Tools from the menu by selecting Tools > Web Developer > Toggle Tools or use the keyboard shortcut
- Edge (Microsoft)
- To open the DevTools, Select
F12or SelectCtrl-Shift-Ion Windows/Linux orCommand-Option-Ion macOS.
- To open the DevTools, Select
Open Devtools
To open the developer console window on Chrome, use the keyboard shortcut Ctrl-Shift-J (on Windows) or Cmd-Alt-J (on Mac). Alternatively, you can use the Chrome menu in the browser window, select the option "More Tools" and then select "Developer Tools."
Say Hello to the Chrome DevTools! Come on! I didn't hear you say Hello :frown:
This is where you interact with the DevTools and you'll see many many different options that you can select and interact with. At the top of the DevTools page you'll see a menu bar with the main pages available plus some strange icons.

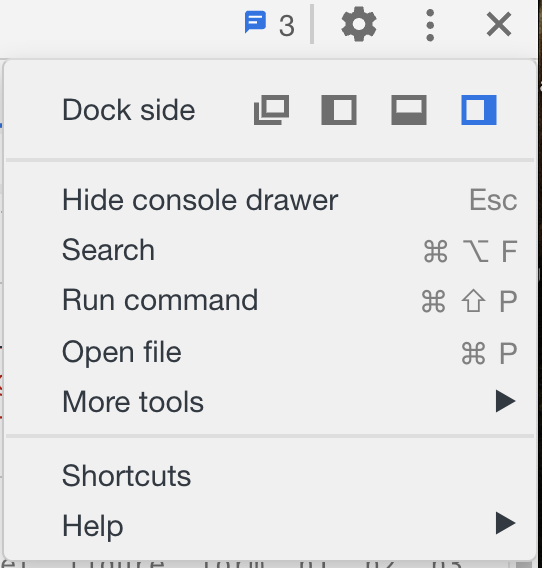
Controls on the Right
Let's start at the right hand side. The X will close our DevTools window. After we have finished developing we need to close the DevTools window, if we don't it will interrupt our Internet browsing when we're not working.
The next icon beside the X is the Sub-Menu (3 horizontal dots). This menu gives us some extra controls to interact with DevTools. We can move the DevTools window from the right, bottom or left of the page, depending on where we want the DevTools window to appear for our development flow. You can also pop out the DevTools into a window all by itself but make sure when you want it back in the main window, you click on the submenu icon again.
Task 1 - Experiment with the placement of the DevTools window.
Next we have the Settings Cog. This is where we change the settings for DevTools. There are many options in here but the one I use all the time is the Appearance Theme (I love a Dark Theme as it's easier on the eyes). You can configure all the settings from in here so have a look at all settings you can configure.
Task 2 - Change the appearance to the Dark Theme and then reload DevTools.
Element Selector & Device Toolbar
Moving to the icons on the left hand side of the menu we have the Element Selector (Arrow Icon) and the Device Toolbar
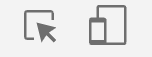
The Element Selector allows us to select any element in the DOM and it will jump to the element in the Elements Tab that shows the source. After clicking the tool (Arrow pointing to the inside of the rectangle icon) you can select any element on the page and see the settings for that element.
Task 3 - Using the Element Selector tool select the BBC logo on the top of the page.
Finally, we have the Device Toolbar which allows us to simulate our page on various devices. This is really useful if we want to see our page on a mobile phone or a different device and different orientations. This view can also be used to explore responsive designs to see how different web elements will interact with various screen sizes. We can also simulate Offline modes to see how the page responds to a mobile device being offline.
Task 4 - Experiment viewing the page on different devices and see if you can find the Capture Screenshot Control (this will be useful in the future).
When you've finished, click on the Device icon to switch back to the standard webview for your device.
Main Controls
For the rest of the workshop, we will work through each of the main tabs in Devtools:
- Elements
- Console
- Sources
- Network
- Performance & Memory
- Applications
- Security
- Lighthouse
Each step will feature the key functionality in each tab and we will walk through some of the important tools you can use to help you debug your website.
Let's Go!
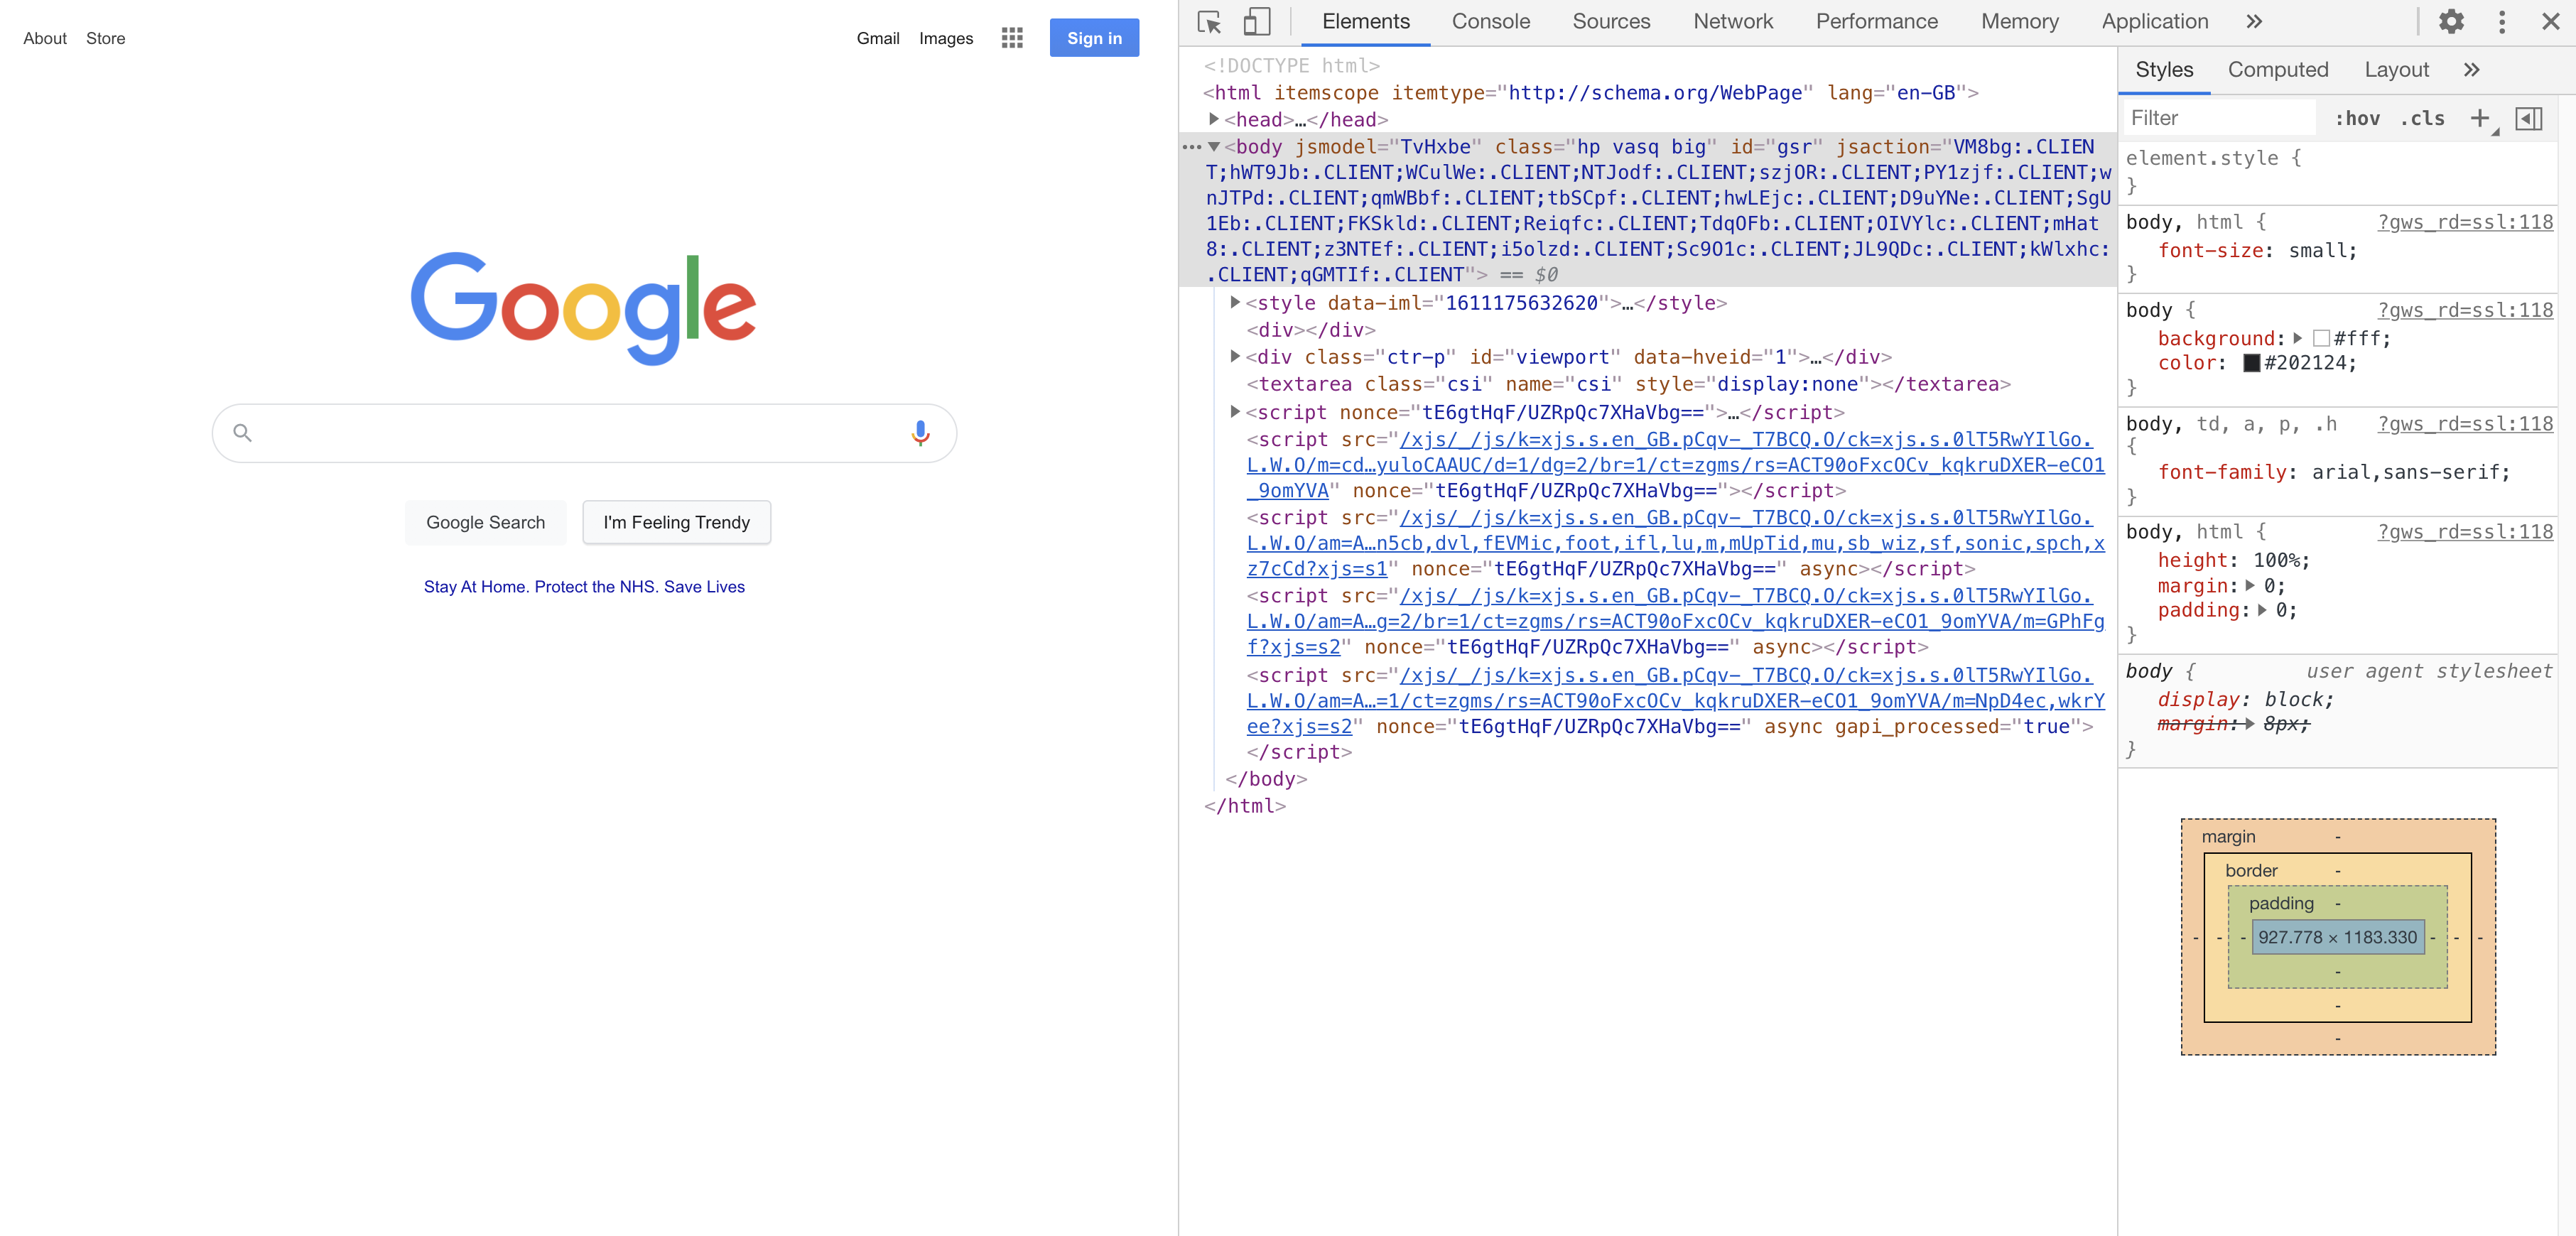
The Elements Tab
The Elements tab of DevTools is broken into two main sections. On the left hand side we have the HTML source code of the page (the DOM) and on the right hand side we have the Styles panel which shows the CSS rules of the selected element.
Just as you did on the tab before with the Element Selector tool you can mouseover any of the elements in the pages source code to select an element you wish to select. As you do this then you'll see that the element will turn into a different shade of colour as you select it on the page.
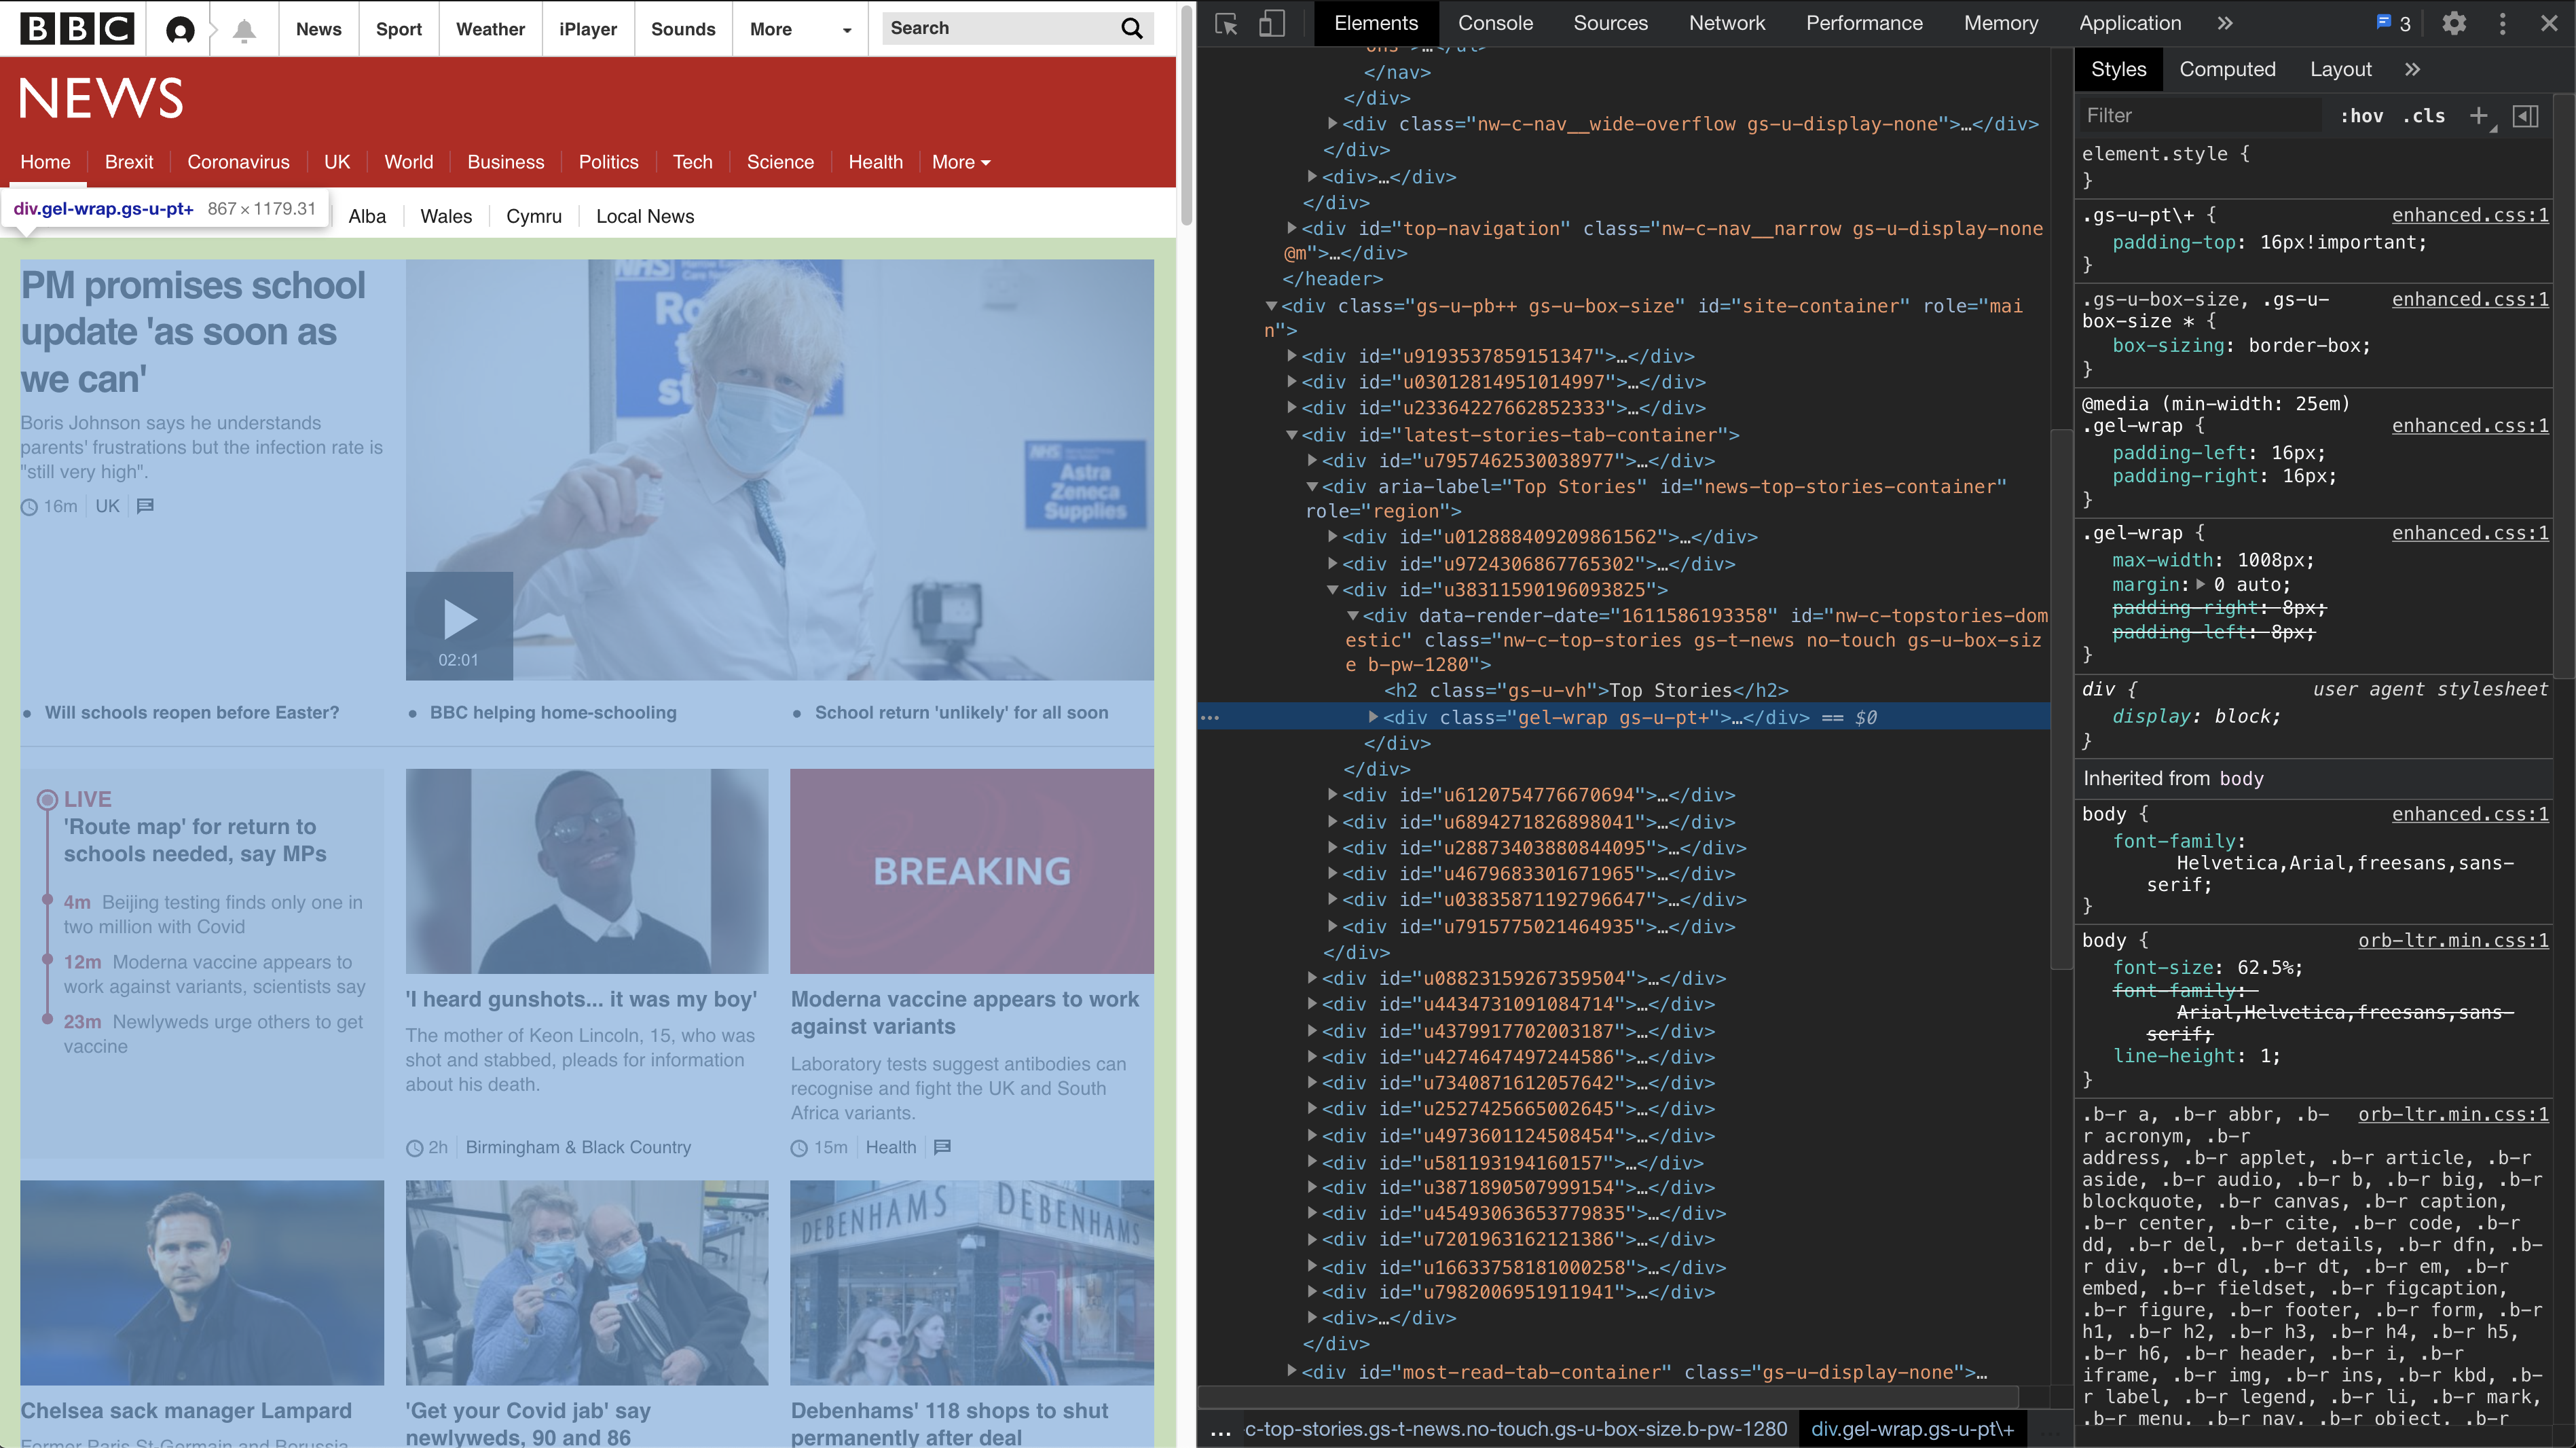
As you'll see in the screenshot above, the main div is highlighted in blue. The padding around this div is shown in green and, not shown, if the div had any margins this would be shown in orange.
The Style tab on the right-hand side shows the CSS of the div selected. Each style rule shows the properties that have been defined as well as link to the file which has that rule selected. This is useful if you have multiple CSS style sheets and have to edit a rule for a specific element.
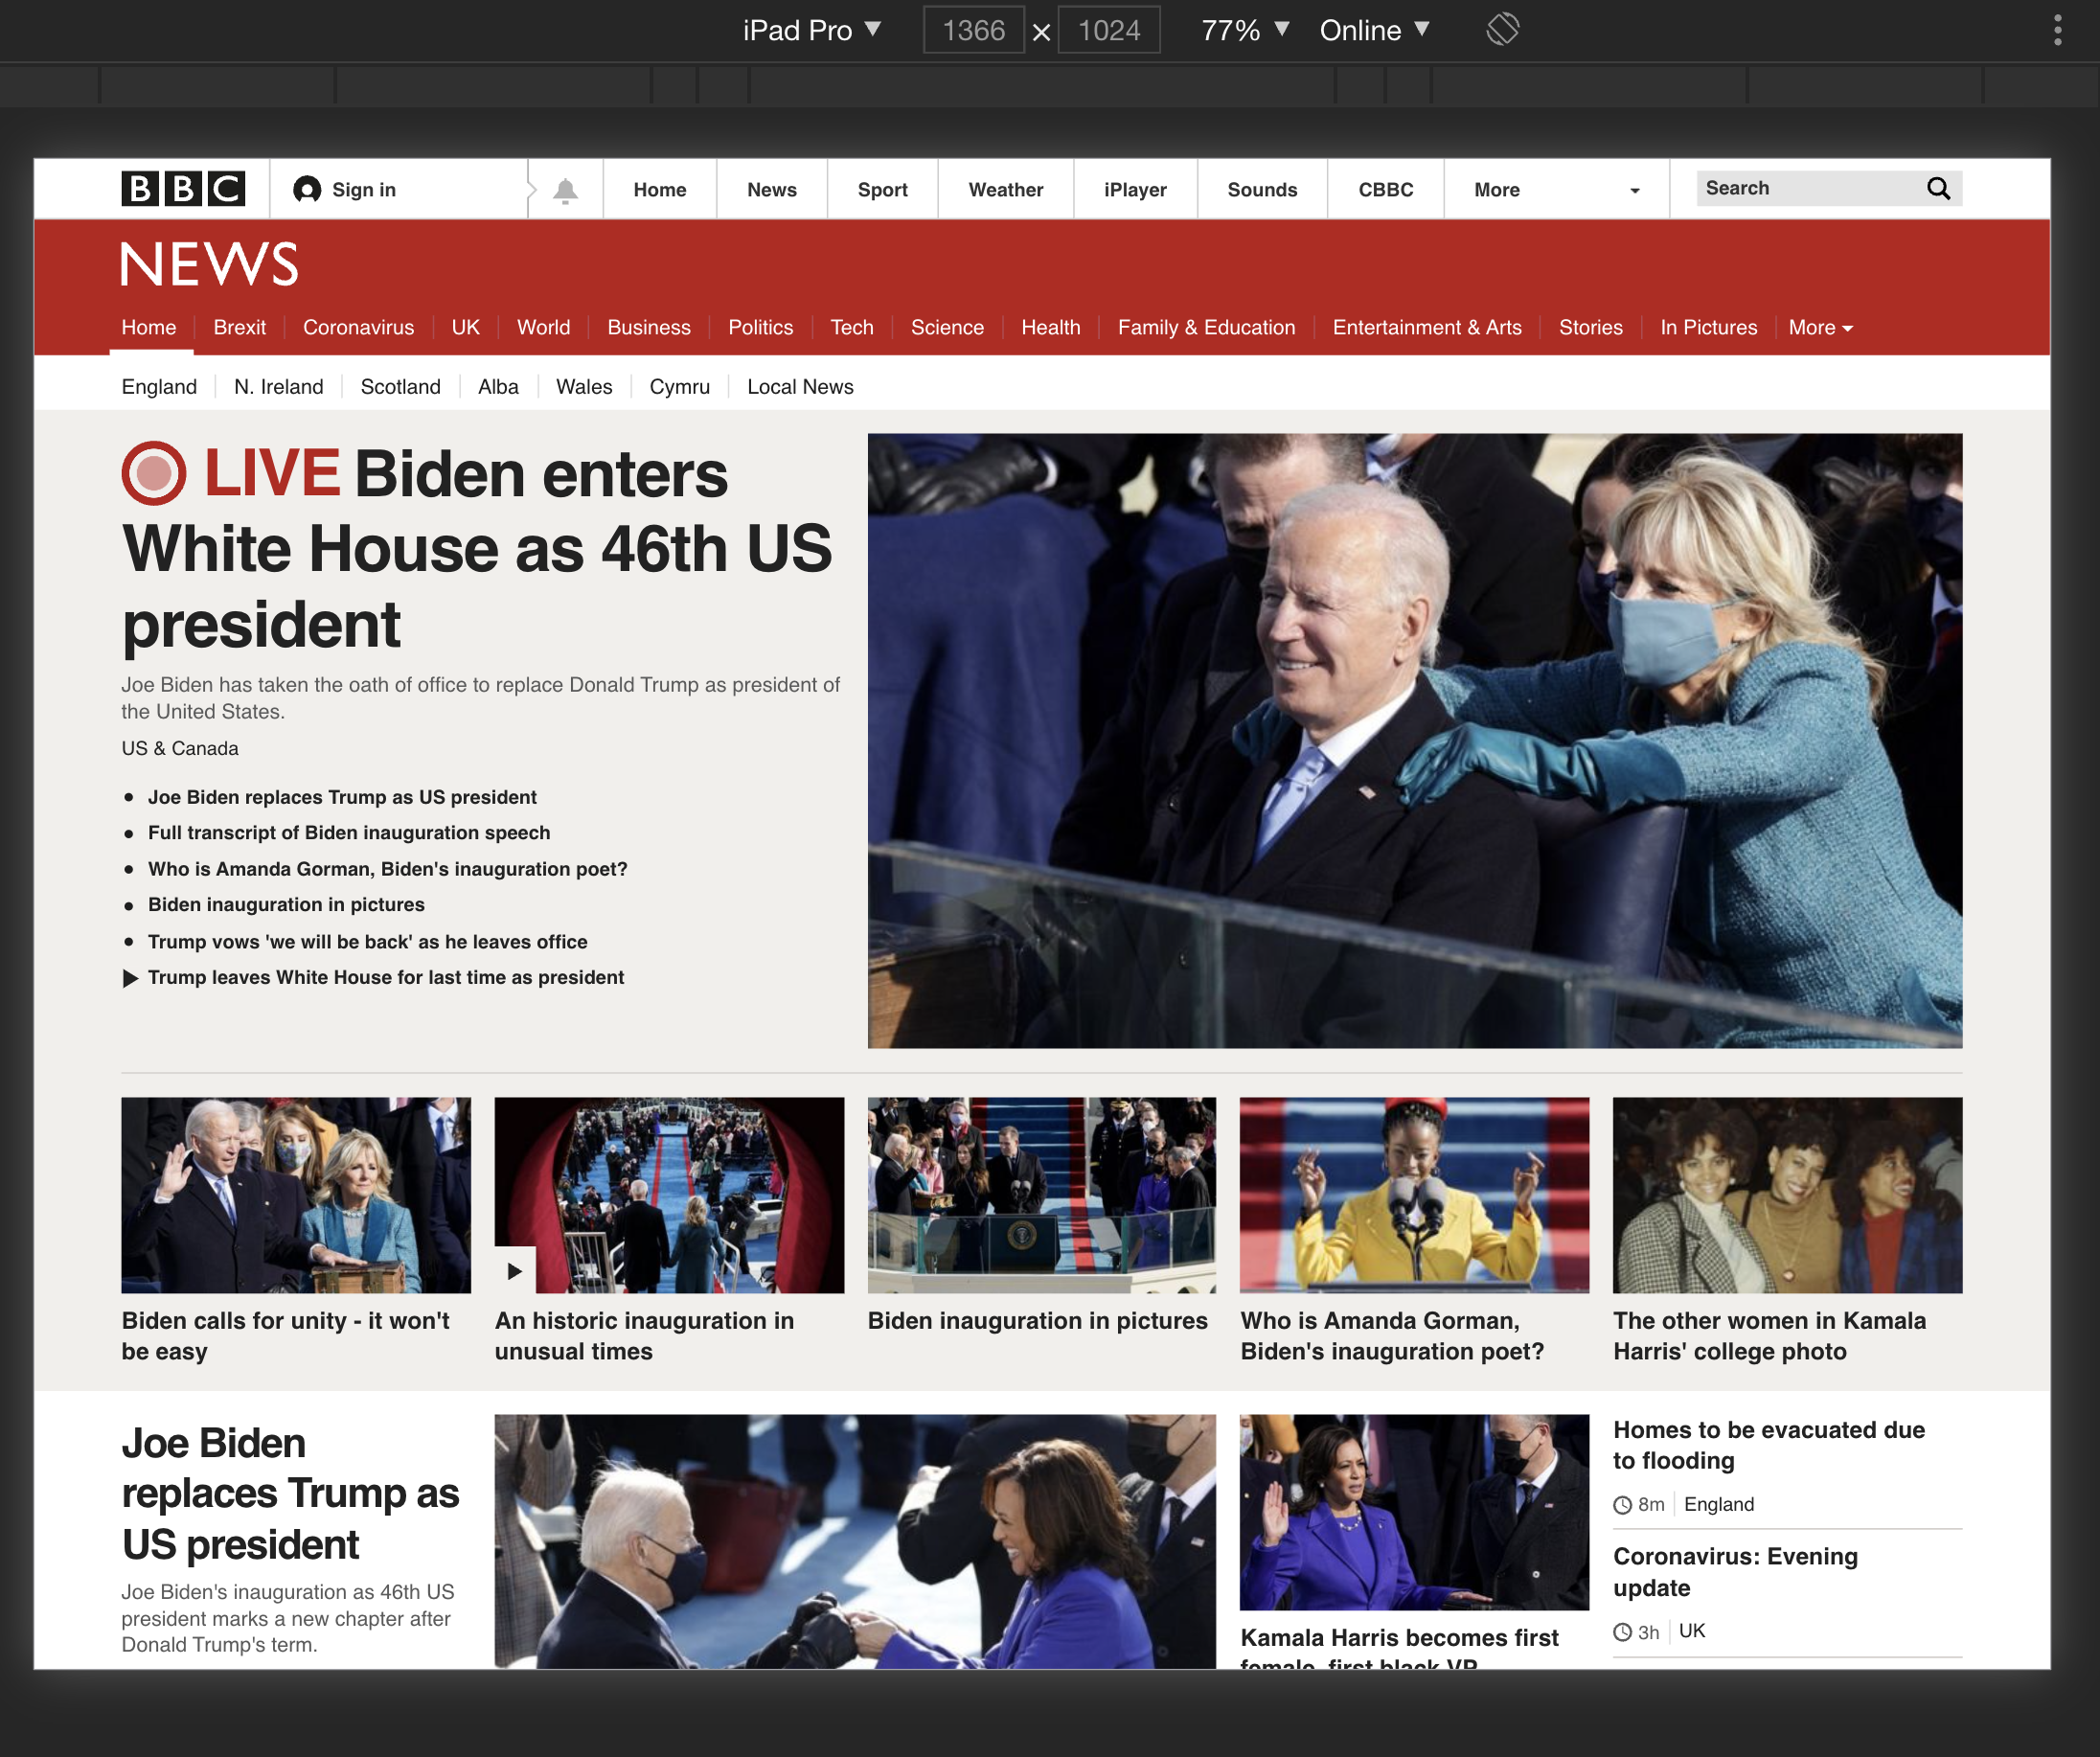
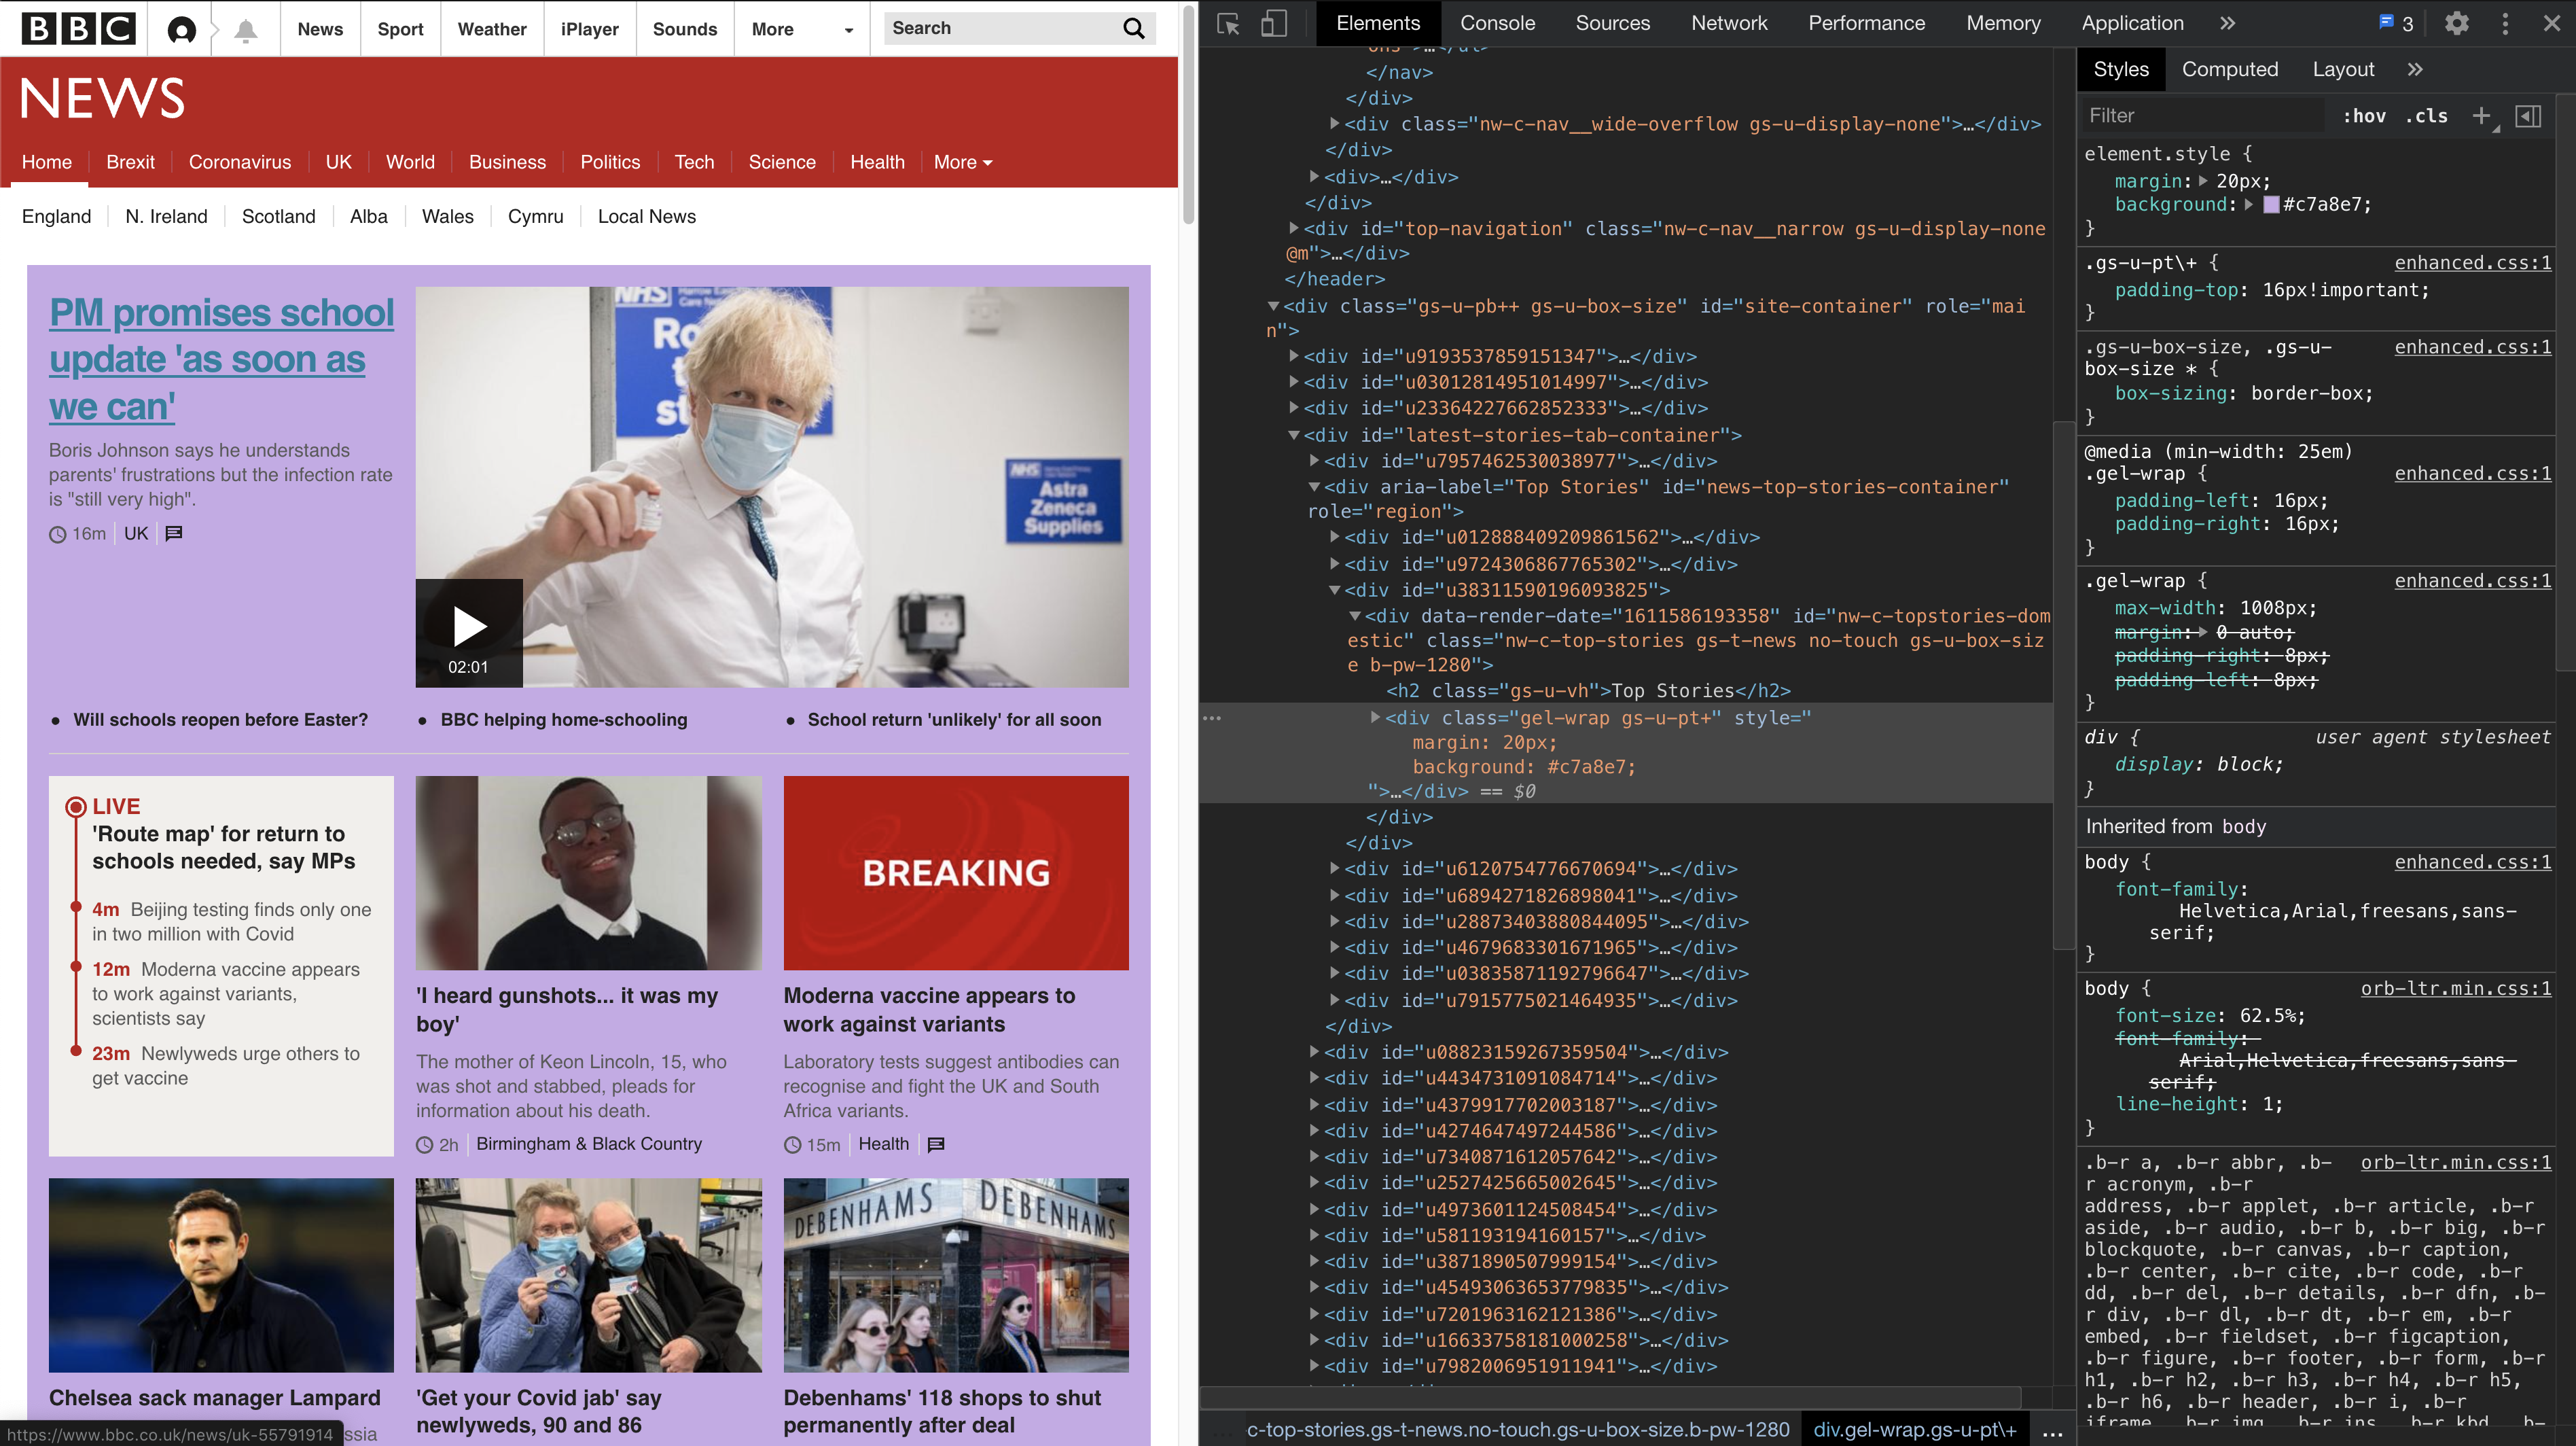
The element.style card at the top of the page will allow the developer to add temporary style rules to the selected element and the page will update automatically as you add type in the CSS rules. So by adding the following rules to the main body tag:
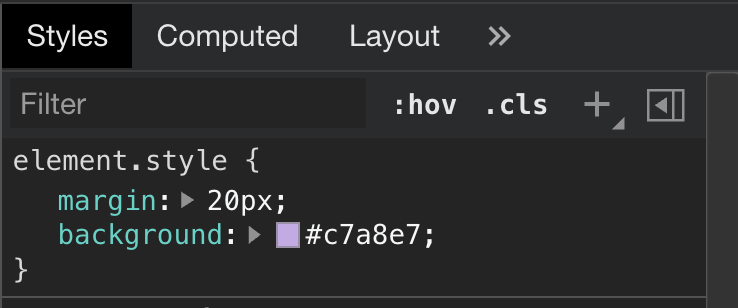
will make the BBC News page look like this:
Task 5 - Play with the Elements Selectors and CSS rules to give the BBC News page your own unique style.
Editing the DOM
The source code view can be used to edit your local copy of the website. After you've selected the element, you can expand or contract the DOM to examine the various levels of the tree and even edit them. This is an interactive view where you can add, delete and elements on the DOM and they'll update live on the page. For example:
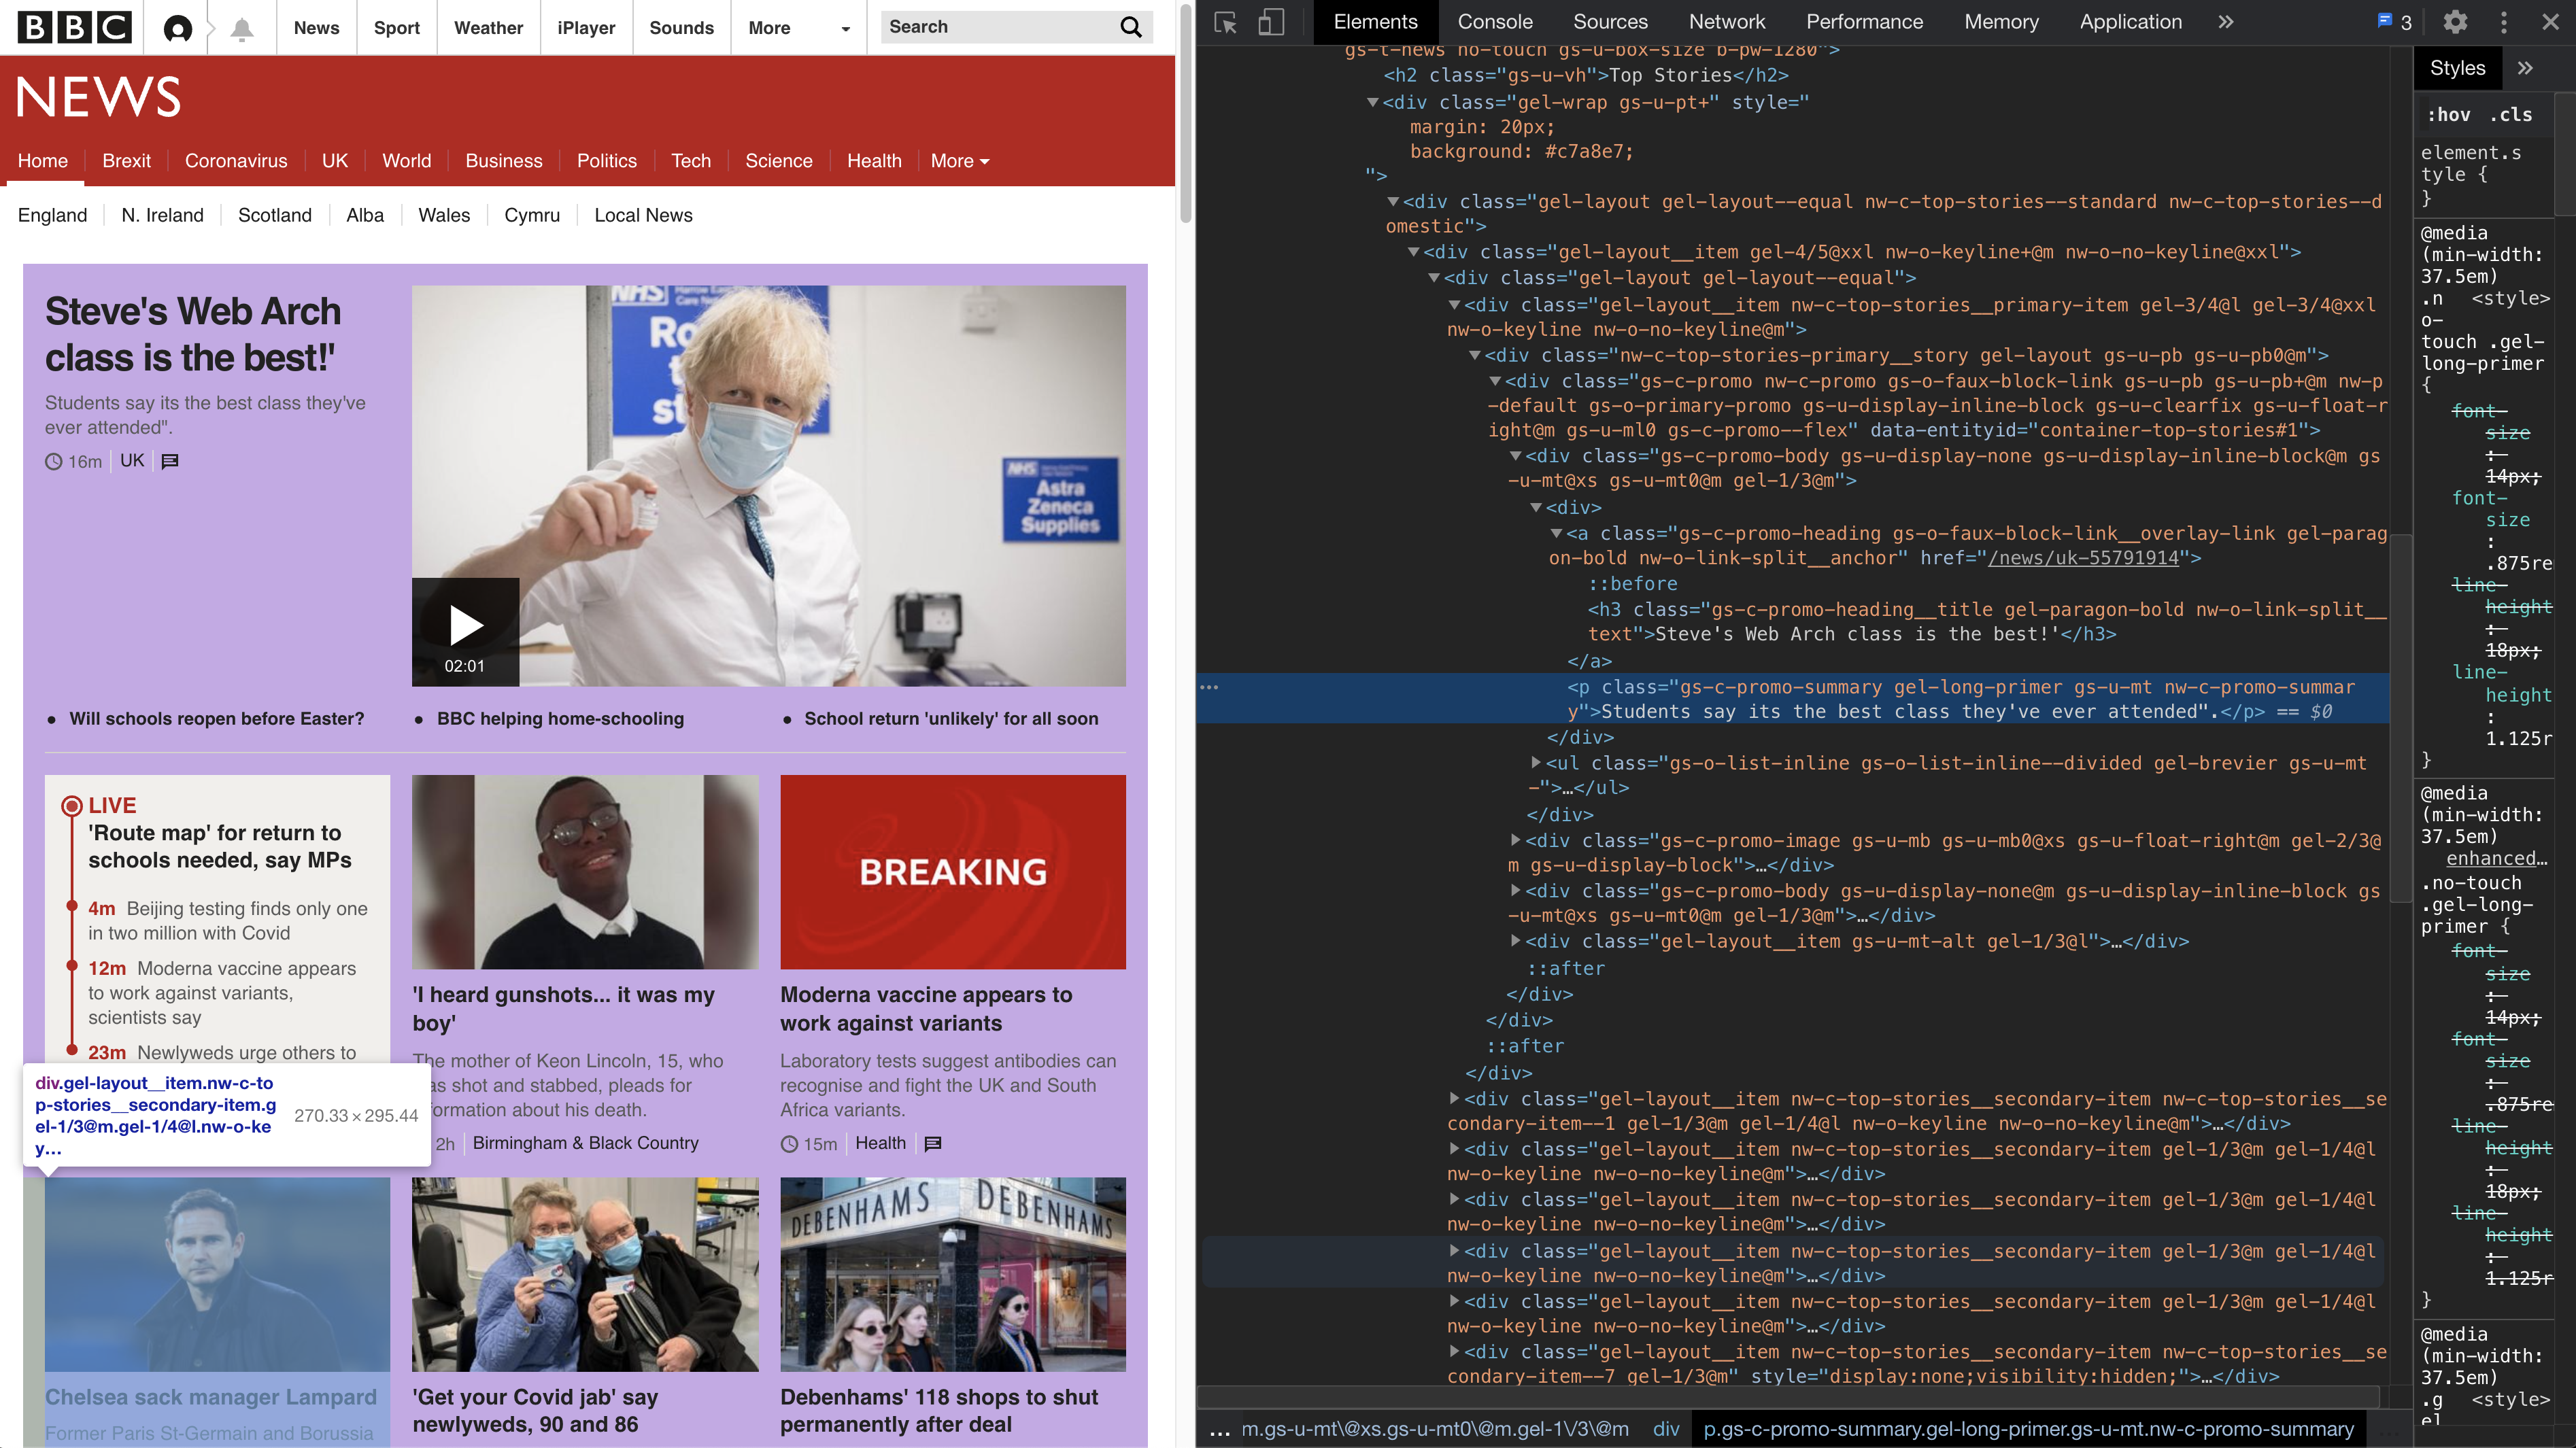
Spot the difference?
If you right-click on an element you'll be able to edit, add, delete the element and also screenshot the page if you so wish.
Task 6 - Edit some of the BBC News Webpage to get a feel of how this tooling works.
NB: When you refresh the page all your edits will be lost. Also, please act responsibly and do not screenshot an edited page and try to pass it off as real. Many students have got in trouble with this before and it's just not cool!
The Console Tab
You should have had some experience with the Console Tool last session in Workshop 1. The Console is an interactive JavaScript console, where developers can enter JavaScript commands and see the results within the console. This is, what's known as a REPL (Read–Eval–Print Loop) or a Shell, a shell is just a software program that interprets commands from the user.
When you enter a JavaScript command and press enter then your command will be run and return the value.
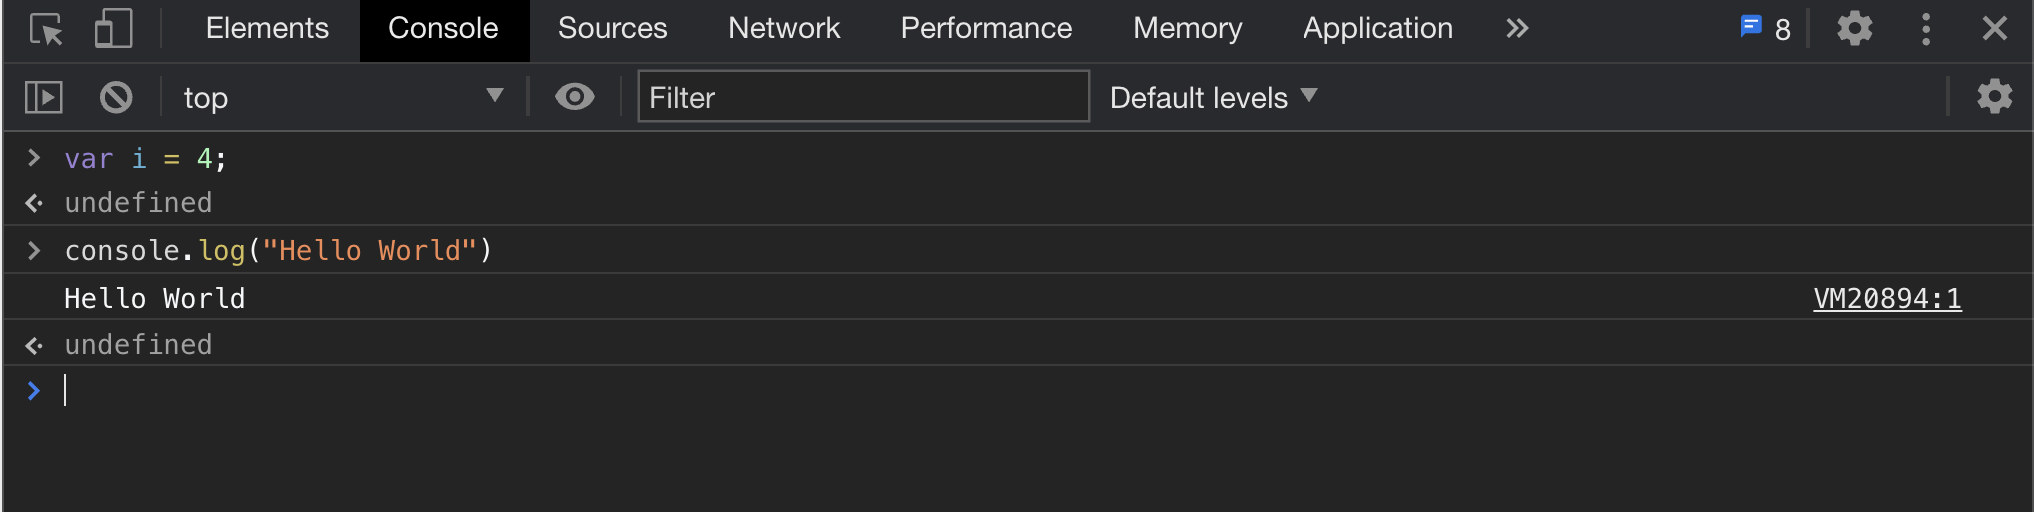
If you get undefined, that's the shell telling you there was no return command. console.log("") will return a string which will be displayed within the console.
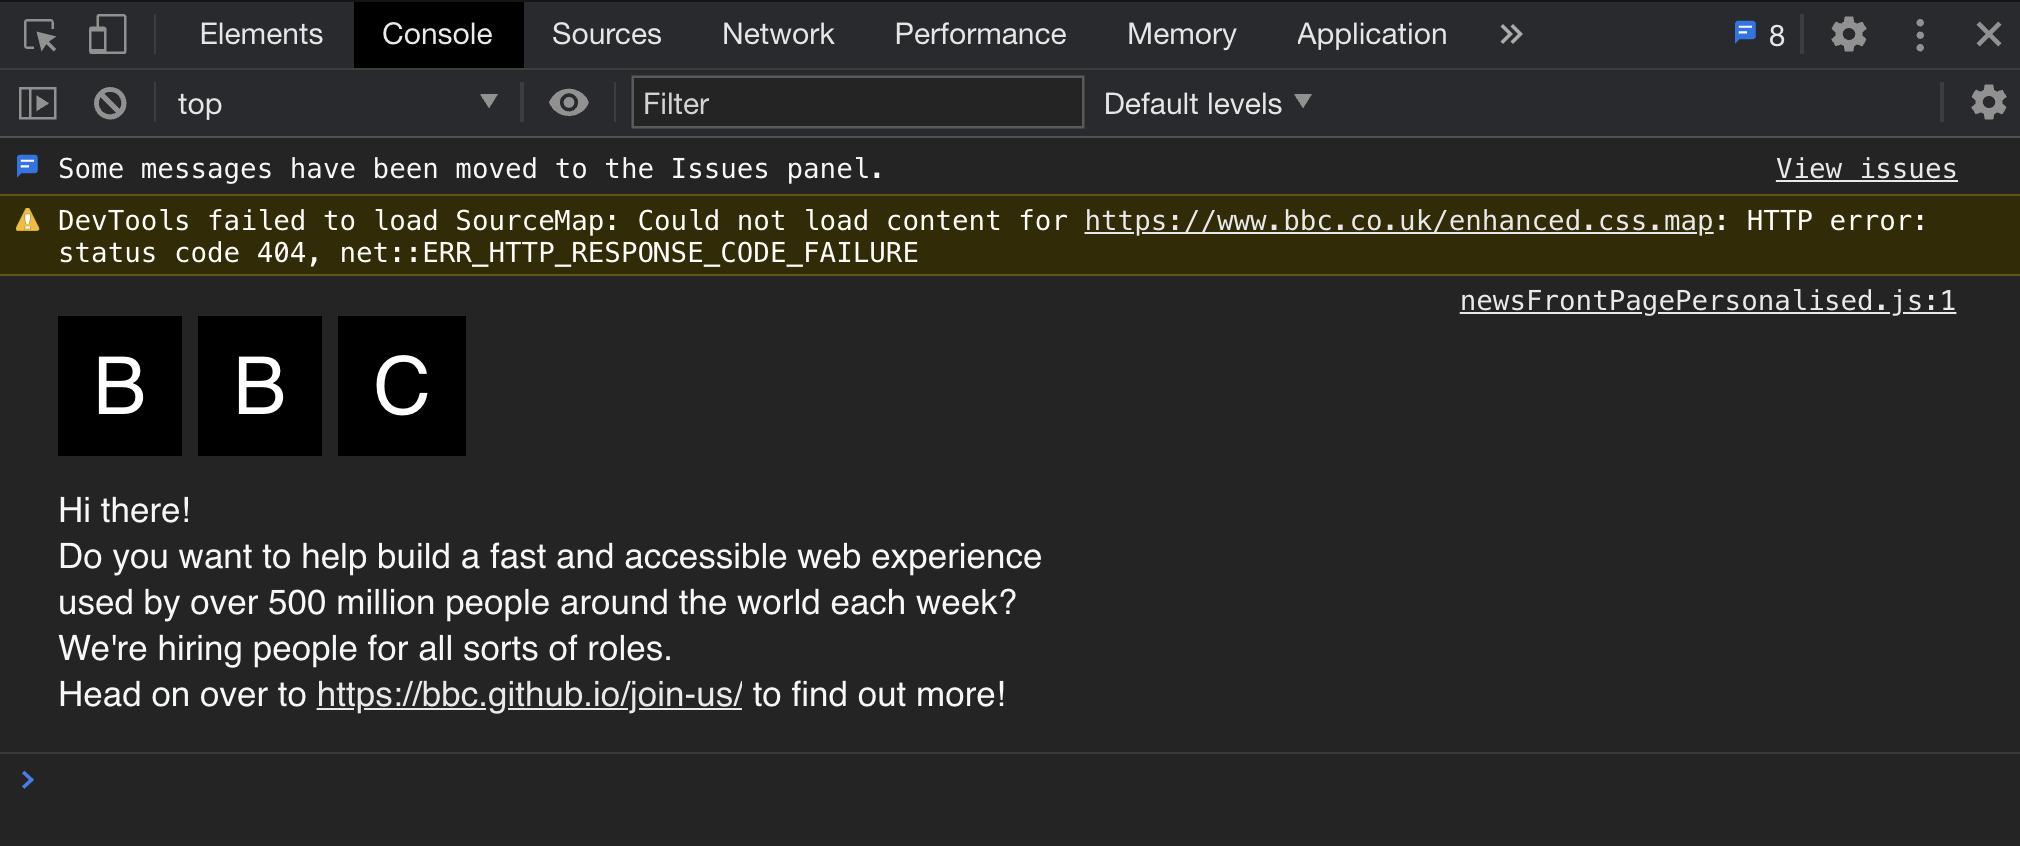
On some websites they'll even leave Easter Eggs in the Console for developers to find. For example, the BBC News website shows this if you open the console on the page:
Logging to the Console
Logging to the console is one of most common uses of the console while debugging JavaScript code for websites. There are many functions we can use to log data depending on what code we are creating. Lets assume we have the following code, copy and paste this code into the console.
var counter = 22;
var object = {"name": "Steven Gray", "age": 30, "department": "CASA", "Job Title": "Researcher"};
We can log some data to the console with the following commands:
console.log("This is a normal log:" + object.name);
console.error("This will trigger an error: " + object.department);
console.warn("This will trigger a warning: " + object.age);
You'll see that the first line will look like normal text. The second line will generate an error, and finally, the third line will trigger a warning. Again, depending on what you need to log, these commands are useful to see where an error might occur or trying to figure out what value a variable has at any point in our code. This is like the print() command in Python.
If you want to inspect an object you can use console.dir() to see the contents.
console.dir(object)
This is really useful for looking at JSON objects. Let's fetch my GitHub user details and log them in the console:
var profile;

fetch('https://api.github.com/users/sjg')
  .then(
    function(response) {
      if (response.status !== 200) {
        console.log('Looks like there was a problem. Status Code: ' +
          response.status);
        return;
      }

      response.json().then(function(data) {
        console.dir(data);
        profile = data;
      });
    }
  )
  .catch(function(err) {
    console.log('Fetch Error :-S', err);
  });
When you run the above code (copy and paste this into the console), you'll see the word Object and then you'll be able to click it to see the data in the JSON object.
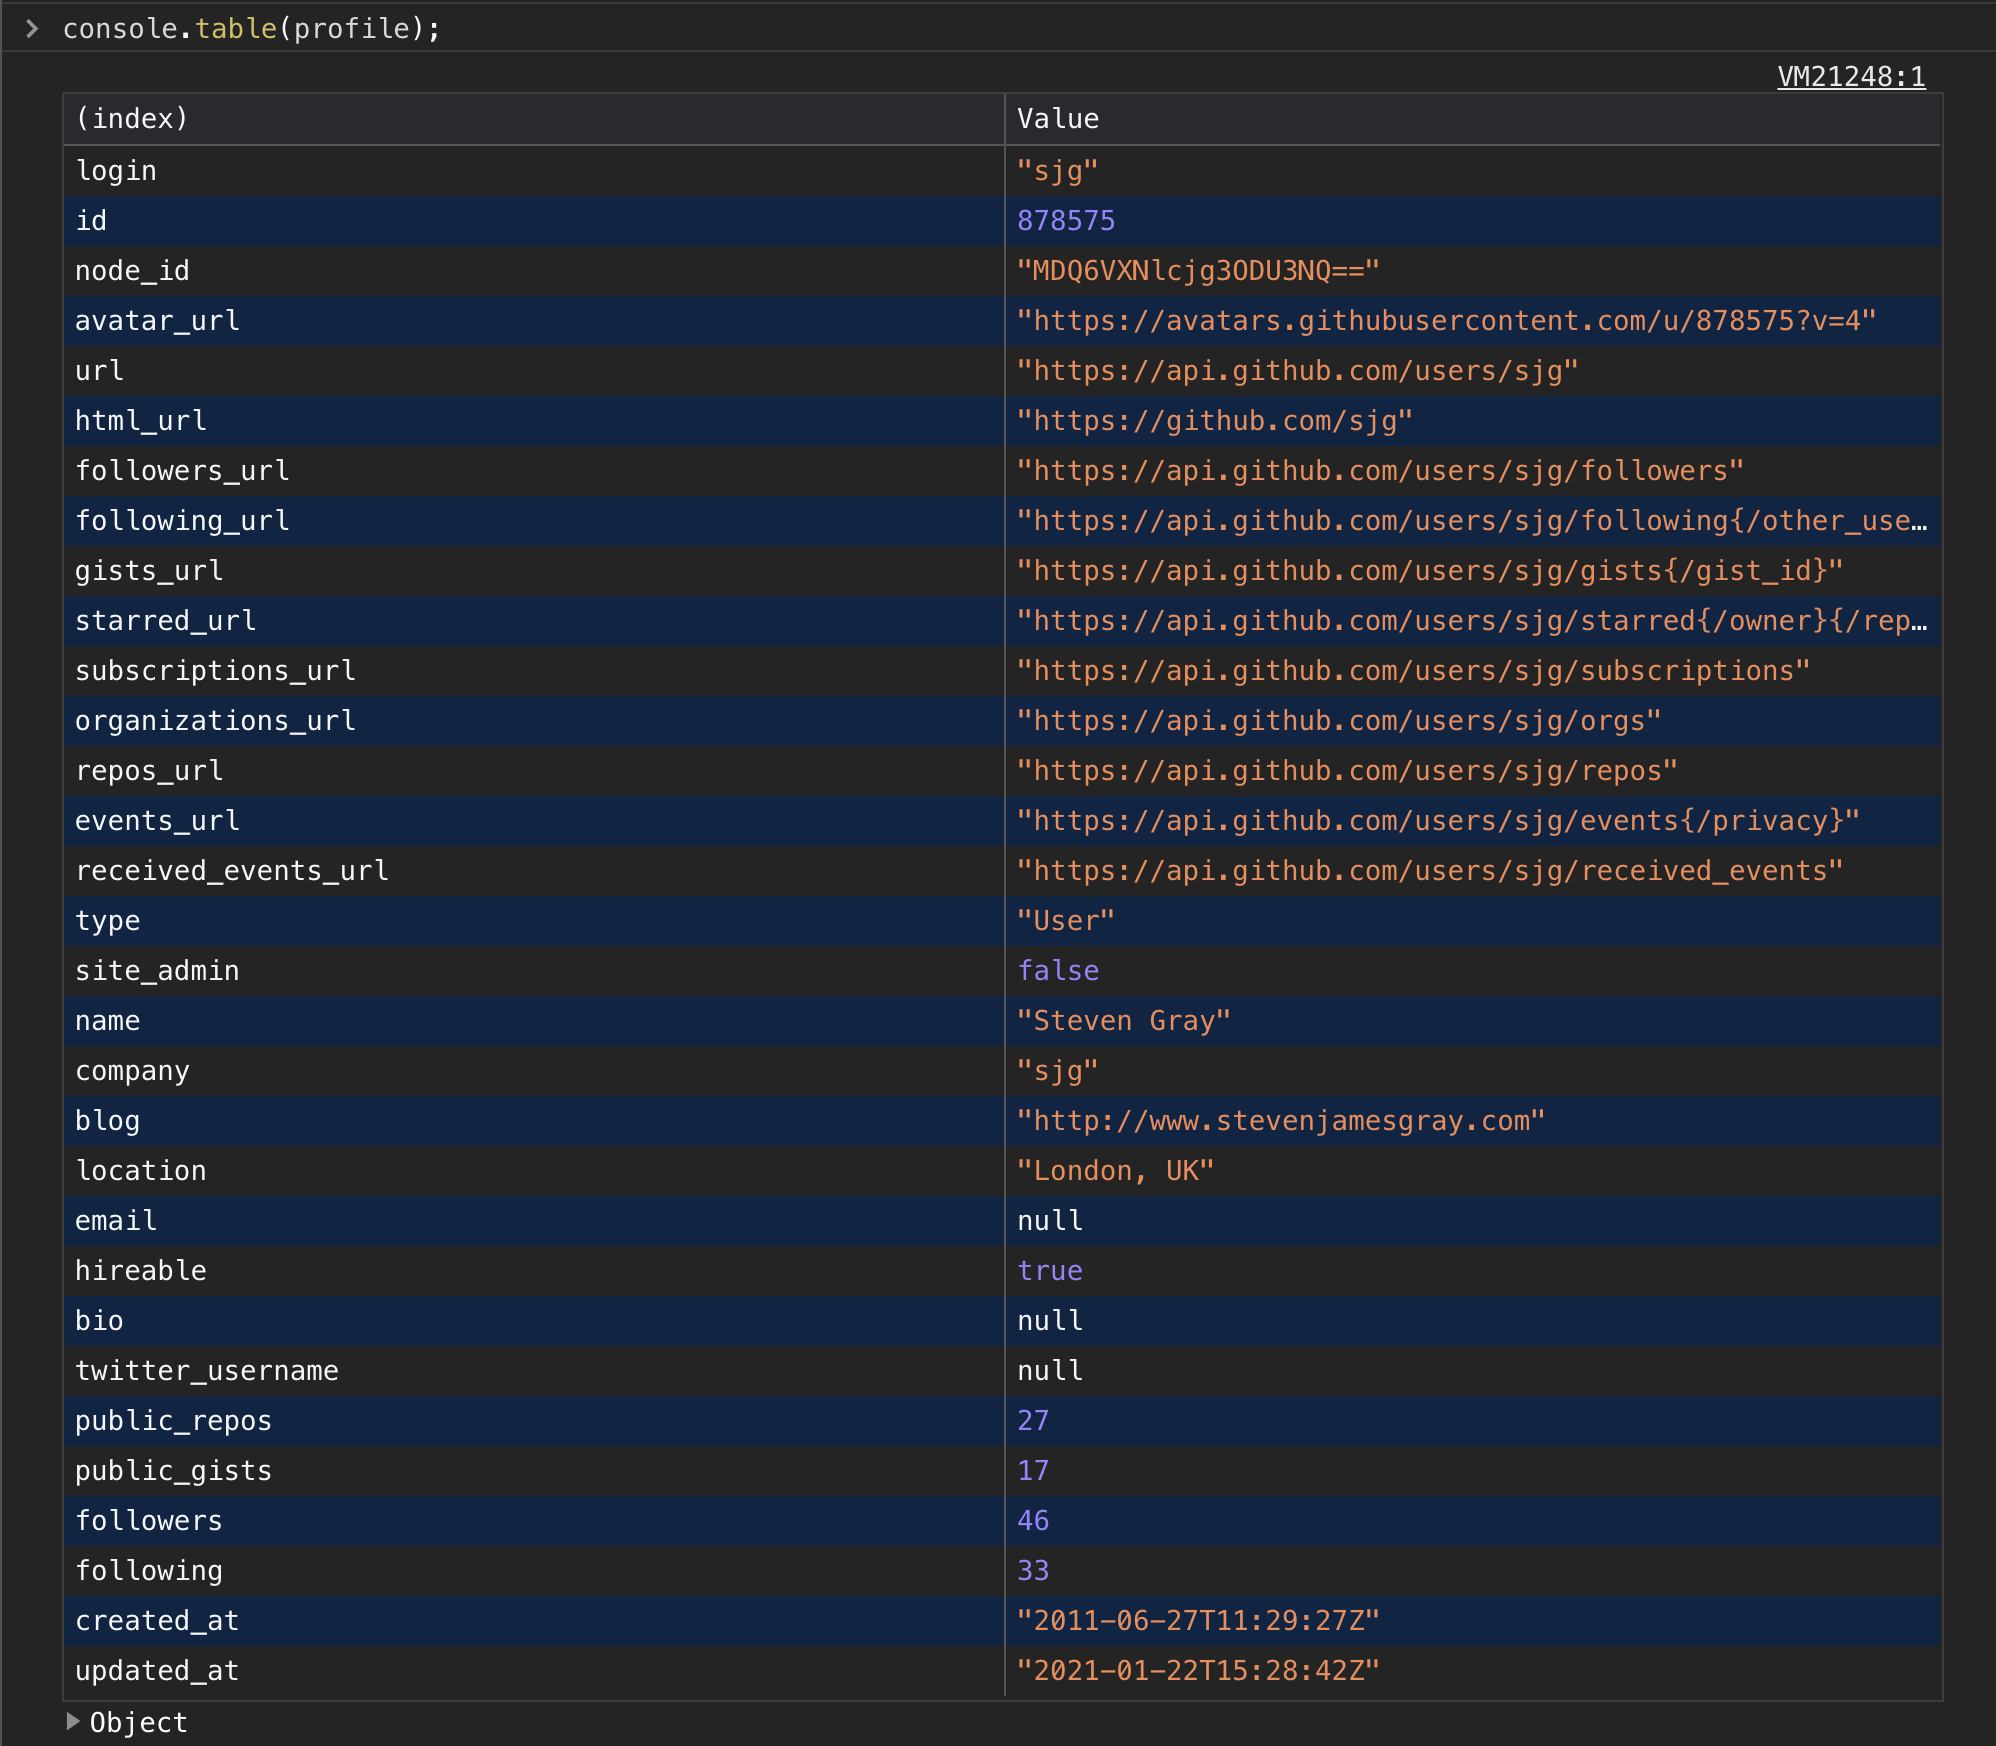
As you can in the see in the code, we've saved the profile data in an object, although there is one final console command that will print the object as a table:
console.table(profile);
Task 7 - Play with the logging code and fetch your own GitHub profile to view the information within.
Grouping Console commands
You can also group console.log commands together. Use console.group() to group commands together. The string is an ID and you have to use it within the console.groupEnd() command.
console.group('Say-Hello-Group');
console.log("Hello World");
console.log("We can group the commands together.....");
console.log("in seperate lines so it's easier to read!");
console.log("Also you can collapse the comments as well since it's grouped.");
console.groupEnd("Say-Hello-Group");
If you run this code then you'll see them grouped together and you can group them in various ways so that you can navigate logs in the console easier.
Timing Console commands
You can also time code, if you think something is taking too long to load, then console.time() will start a timer and then log the time taken on the console.
Run the following code:
console.time("timer-ID");
for(var i=0; i<=1000000; i++){
  var array = [0,3,0,2,0,0,9,0,0,0,1];
  const months = ['August', 'March', 'Jan', 'Feb', 'Dec'];
  months.sort();
  array.sort();
}
console.timeEnd("timer-ID");
Ignore the code between the console.time() and console.timeEnd() commands - this just sorts two arrays a million times (so we can see something taking a long time).
At the end of the command it will show how long in milliseconds the command took to run. On my machine it took timer-ID: 744.4111328125 ms or 0.74 seconds.
Edit the for loop so that it sorts the arrays 5 million times rather than a million. You may need to wait a few seconds before the timer finishes depending on your machine.
The Sources Tab
Did you know that DevTools can be used as a development environment? Well it can, and it allows us to edit our pages quickly and, as developers, we can edit HTML and CSS values in the browser. The Sources tab allows us to look at the files that are loaded remotely as well as editing a workspace locally. If you set up a local copy of your website in the browser then you can edit the files within the sources tab. You can also use this view to debug your JavaScript code.
Workspaces
Here is a working example of setting up Workspaces and how to use them. I prefer to use VSCode or Sublime to do my edits and then refresh the browser but this is another way of using the browser as an IDE.
Snippets Tab
This area allows you to create Snippets of code which might be useful in the future. You can learn more about this section and how to use is here
Debugging JavaScript
Debugging JavaScript can be a pain and using lots of console.log() statements can get confusing. Instead, we can use Breakpoints and Variable Inspection to see what values are stored in our code and step through, line by line.
Here is a quick guide on using the Sources Tab to debug your JavaScript code.
The Network Tab
The Network tab shows the developer what resources get loaded at what point and allows them to inspect the data that has been transferred from the server. This section will allow you to explore what's been sent to the browser, how long it took and how much data was sent.
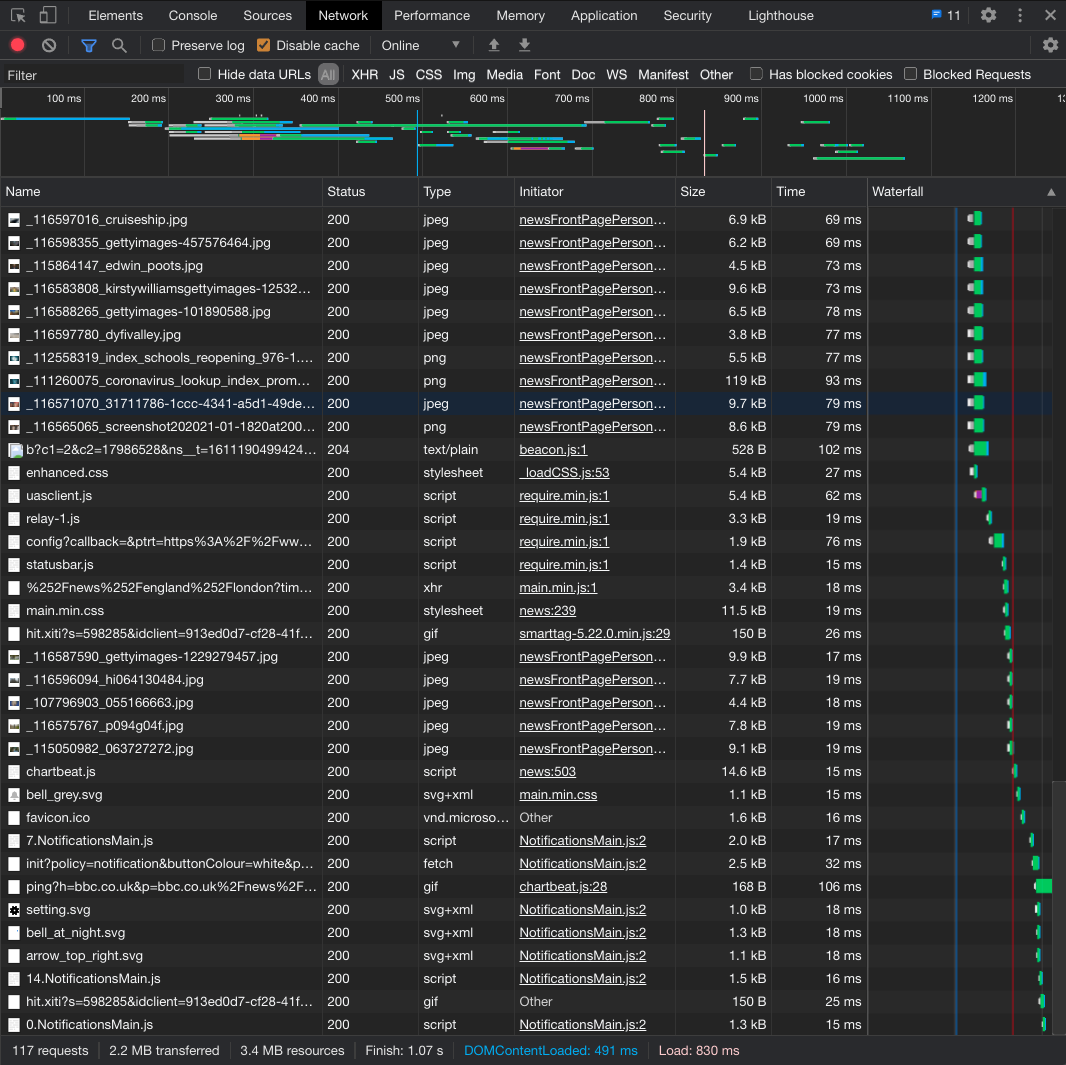
Open the Network tab and reload the BBC News Page. After the page loads you'll see a page like this:
Downloading Data
At the top of the page we have a graphical view of the resources that were downloaded by the page load. The length of the bar is the amount of time it took to download the data.
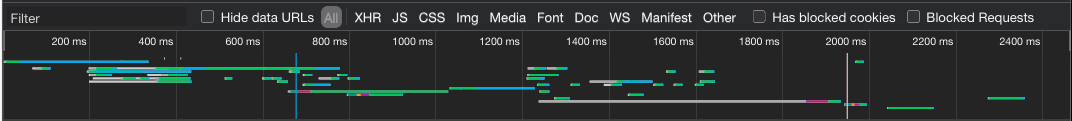
At the bottom of this page you'll see an overview of all the files that were sent to the browser when the page was reloaded along with how long it took to transfer the data. You can use these stats to improve load times of your pages as well find potentially missing files that have failed to download to your machine.

Using the filter bar to find files, or filter all AJAX requests (XHR), JavaScript files (JS), Stylesheets (CSS), Images (Img). Make sure to press the All button to see all the data files

Viewing Individual Data Files
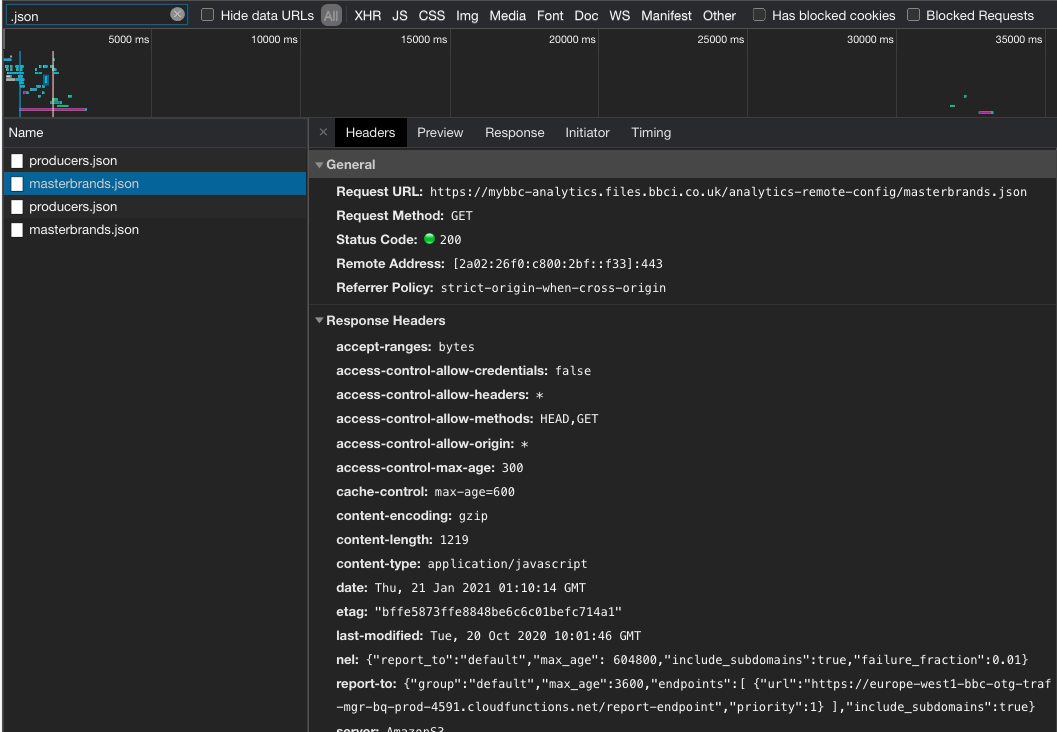
Lets have a look at the JSON files that were sent to the browser. In the Filter bar type .json
If you click on masterbrands.json you'll see some information about where the file was downloaded from as well as some data sent by the server.
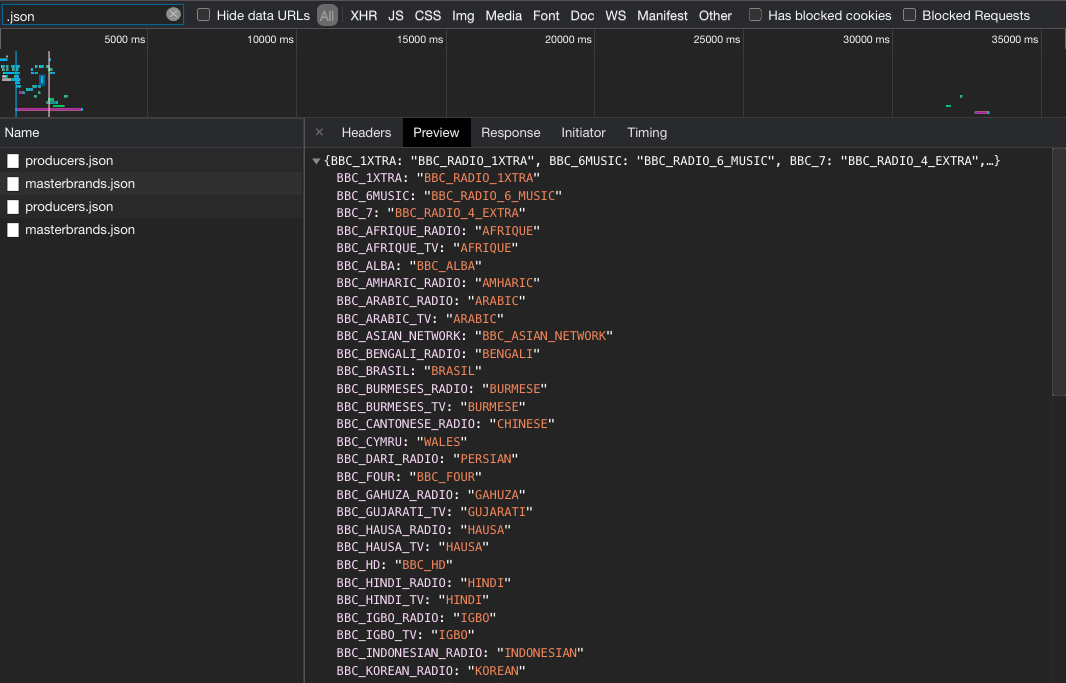
Clicking on the Preview Tab shows us the content of the JSON file. In this case, it's a list of the BBC Brands.
Finally, you can click on the Timing to see how long it took the browser to request the data.
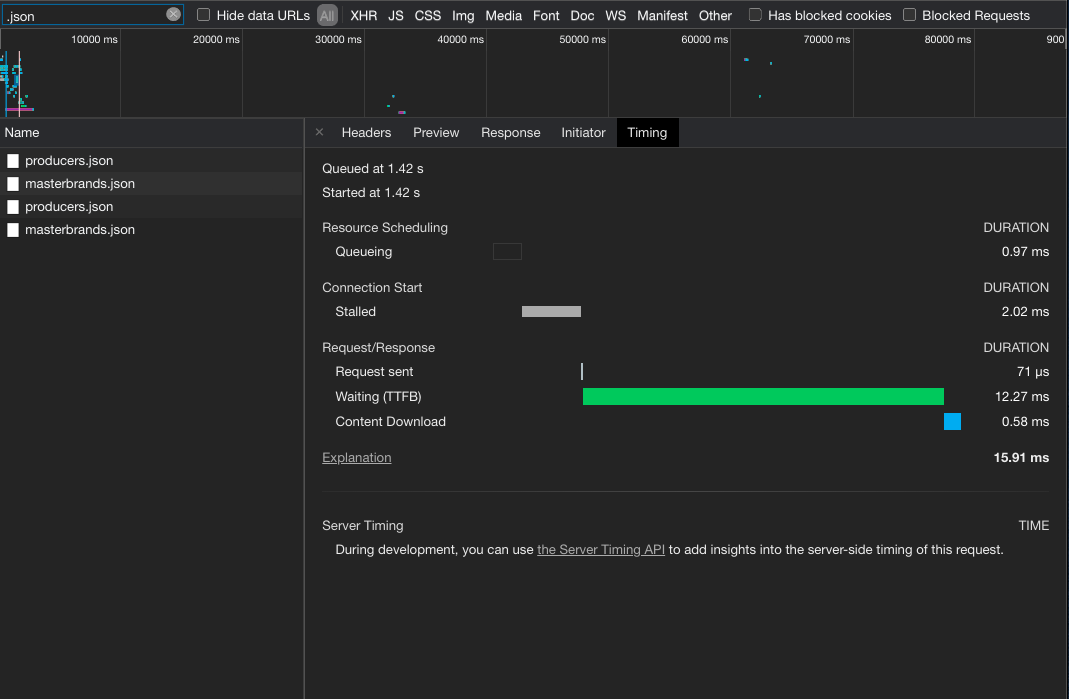
The network tab is very powerful, especially if you want to see what data the browser is using to display data on the website.
The Performance and Memory Tabs
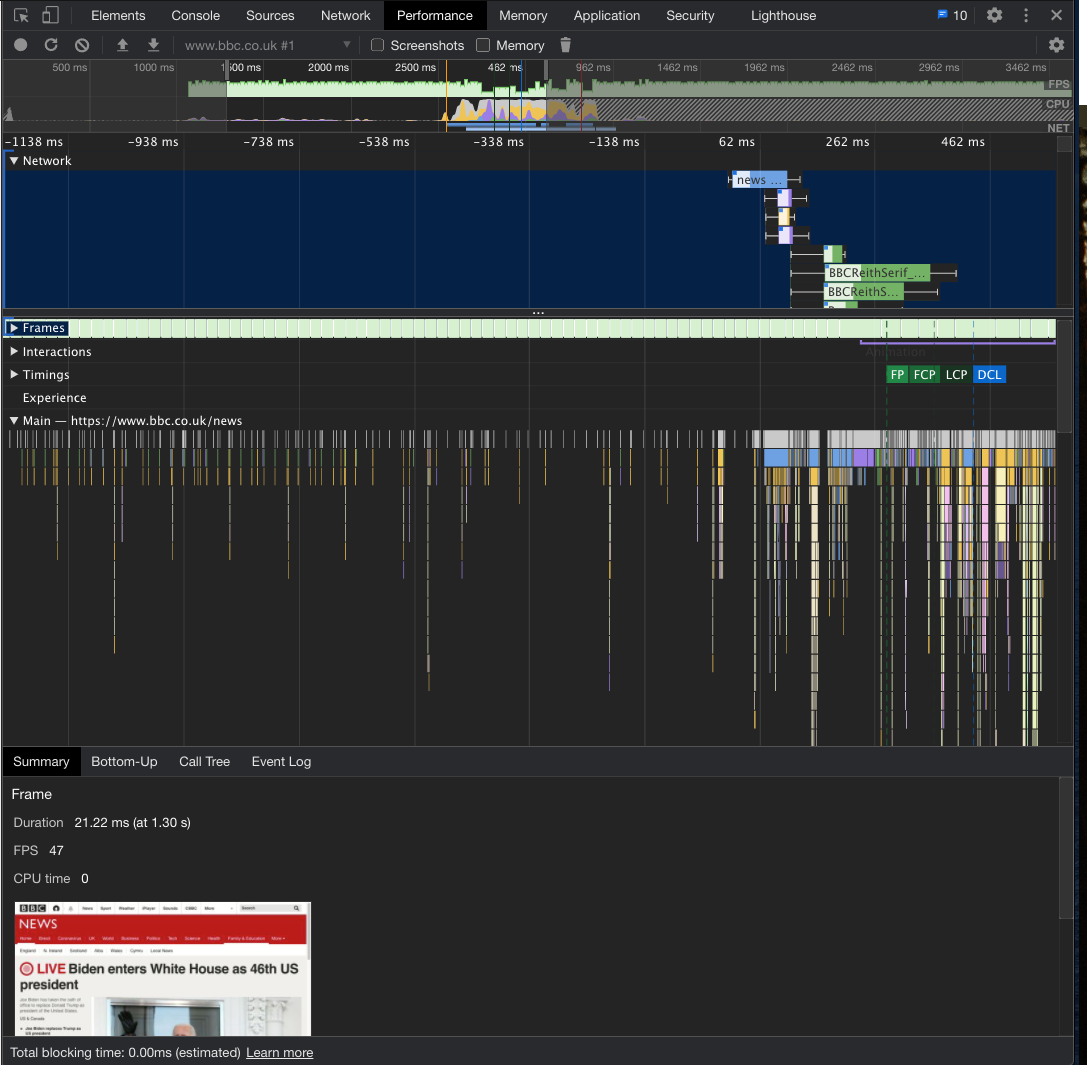
This tab allows us to inspect the browser, the CPU and memory usage of the system when loading a page within the web browser. This is outside of the scope of this module but if you're interested in what data these tools show. when the tools profile sites, then we have provided some screenshots below.
Performance Profile
You can learn more about this tool at https://developers.google.com/web/tools/chrome-devtools/evaluate-performance
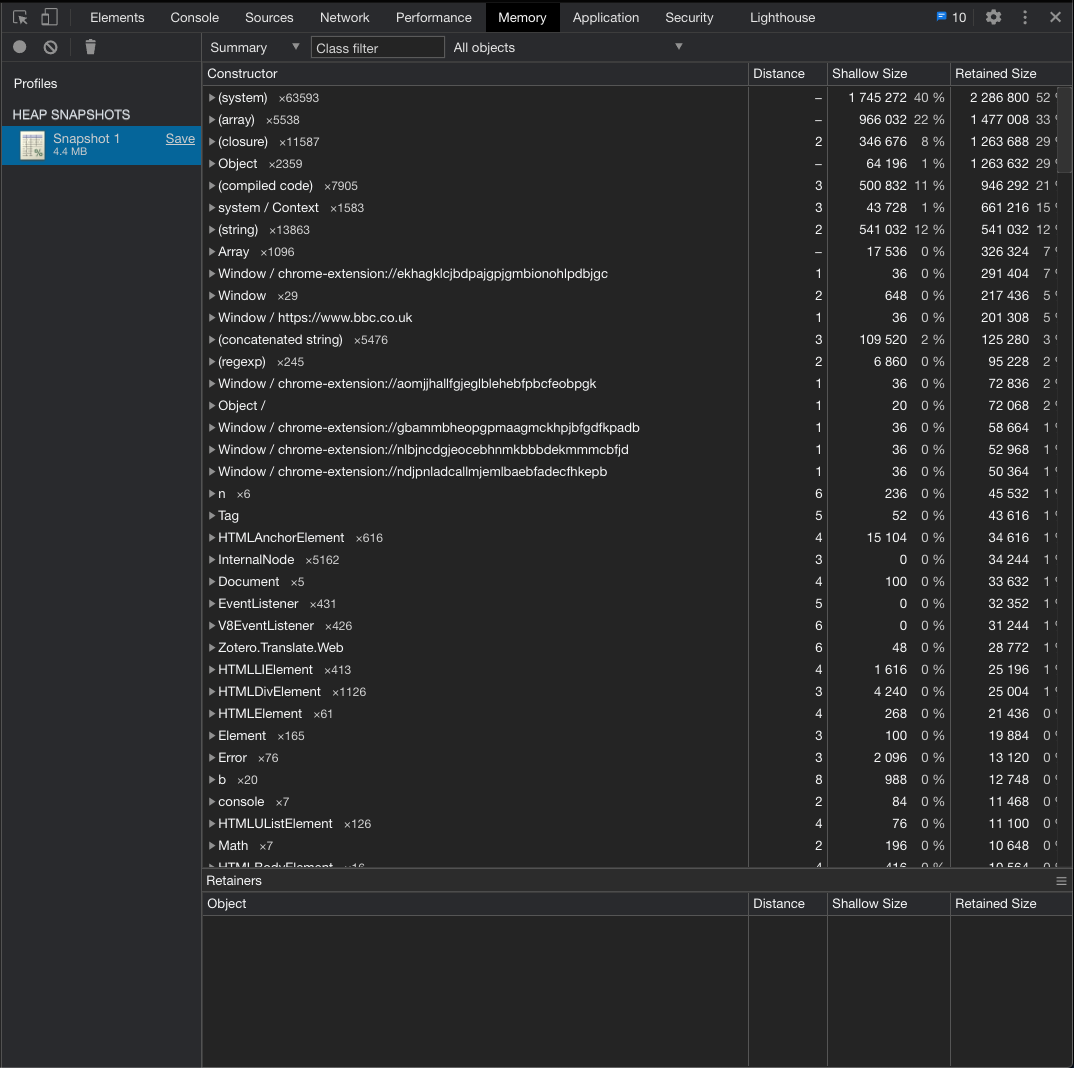
Memory Profile
You can learn more about this tool at https://developers.google.com/web/tools/chrome-devtools/memory-problems
The Application Tab
This tab allows the developer to inspect the local application settings of the browser for each website you view. HTML5 has various tools to allow modern web applications to store data, send push notifications etc. All of these tools and storage lives in the Application Tab. In this module we're going to cover the Web Storage API which exposes Local Storage, Session Storage and Cookies functionality of the browser.
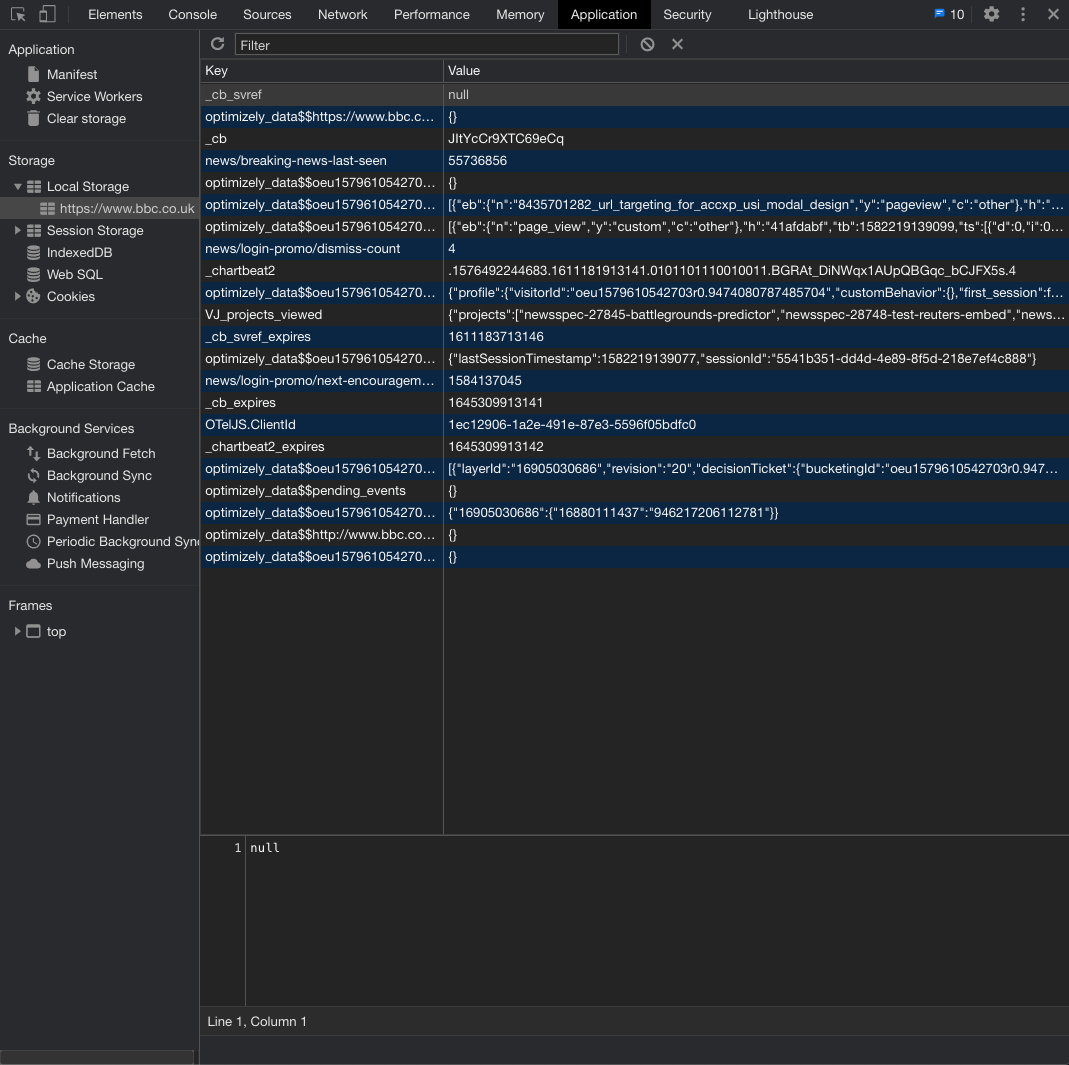
Local Storage API
The Local Storage API allows the developer to store key/value pairs within the browser. When the user returns to the same host website, the key pairs will be saved and the web application can retrieve these values next time the page has loaded.
In the screenshot above you can see the Local Storage Key values for the BBC News page that is being stored within the browser. Let's write some code to retrieve these values and add our own key/value pairs to the site.
Open the JavaScript console and on the BBC News page and run this code:
localStorage.getItem("_cb_svref_expires");
The key _cb_svref_expires (as you can see in Application) return a string which is the Unix Epoch and when you convert this you can see that this number is 30 minutes in the future. All key/value pairs are Strings. The maximum amount of data you can store as a developer in localStorage is 5Mb for all keys.
var UNIX_Timestamp = localStorage.getItem("_cb_svref_expires");
var date = new Date(parseInt(UNIX_Timestamp));
console.log("Expires: " + date);
Whatever this time is used for in the JavaScript code, it tracks an expiry time for something which may trigger something to happen on the page. We can change this value and see what happens on the page. Let's change it to some date in the past and see what happens.
localStorage.setItem("_cb_svref_expires", 1577836800);
Oh well, nothing happens. But we did change the value. Have a look at the key/value pair now and see if the value has changed. We can add our own keys to this page and they will be stored until you clear the values.
Task 8 - Add a key/value pair to the BBC Website that stores the class code (CASA0017) under the class_code variable in localStorage. Verify that this key value pair is shown in the Application tab. Refresh the page and you'll see that it has been saved.
You can delete the key/value pairs by using the following code:
// Delete the Class Code Variable
localStorage.clear("class_code");

// Delete ALL the key/value pairs
localStorage.clear();
Please, please, please never store any sensitive data in the Web Storage API. The users can see the data and it's not secure
Session Storage API
The Session Storage API is similar to the Local Storage API with the exception that when the user closes the browser or restarts their machine, the data will be lost. The Local Storage API will still be available but the Session Storage API will be deleted forever.
To store values in the Session Storage API use the following code:
// Add a Key
sessionStorage.setItem("HelloWorld", "Hello Everyone!");

// Delete the Class Code Variable
sessionStorage.clear("HelloWorld");

// Delete ALL the key/value pairs
sessionStorage.clear();
Other Browser Storage
If you look closely on the Application Tab you'll see other storage options such as IndexedDB and WebSQL. The W3C announced that the Web SQL database is now a deprecated local storage specification so we as web developers should not use this technology any more. IndexedDB is an alternative for WebSQL databases and more effective than older technologies. If you're interested you can find out more about IndexedDB here.
The Security Tab
Next we have security. It's really important that when we are visiting a website or giving credentials over the Internet that we have a secure connection. This is done using HTTPS certificates and in the security tab you can see the certificate chain, the secure connection settings and the resources.
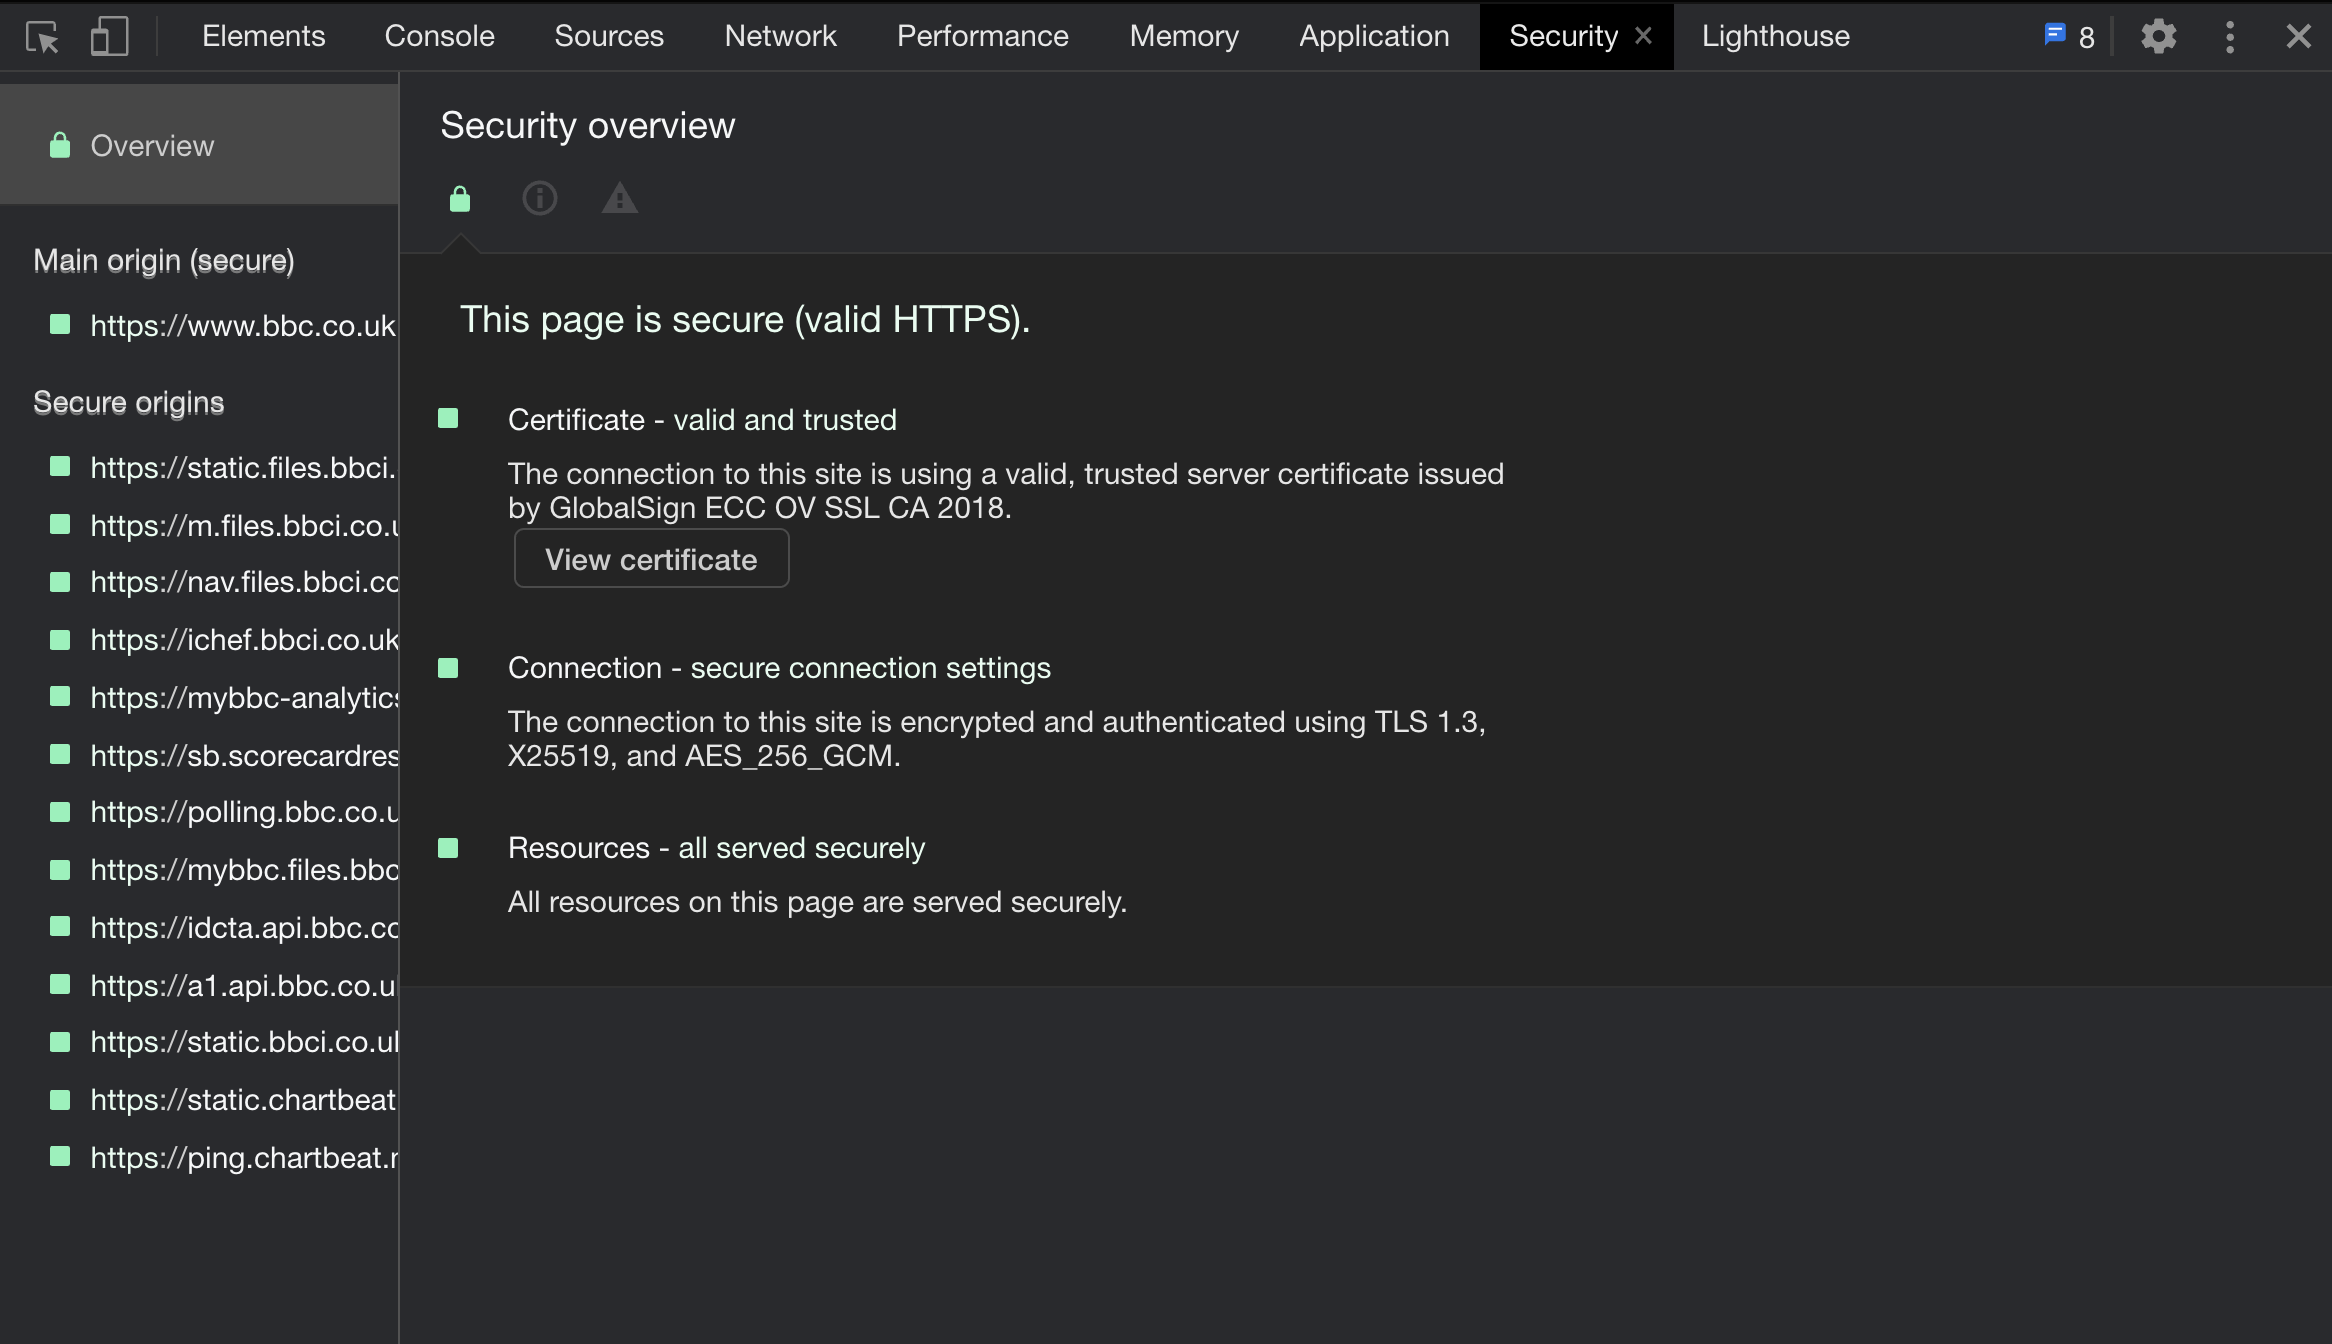
This tab will tell you all the certificates or security errors on a page and will help us secure our website. For a HTTPS page to be 100% secure you must load all resources (JavaScript, images, etc) with https:// links.
Task 9 - Load the BBC News website with the security tab open and view the valid certificate for the site. Then, http://dev.spatialdatacapture.org site to see the difference between a secure and unsecure website.
You can learn how to secure a web server using https://letsencrypt.org/how-it-works/ and scan websites for security issues using https://www.ssllabs.com/ssltest/. When we start building web servers with Express, you'll be able to secure them using this guidehttps://expressjs.com/en/advanced/best-practice-security.html
The Lighthouse Tab
Monitoring performance is an important part of the web development process to give users the best experience on your site. Lighthouse is an open-source, automated tool for improving the quality of web pages. You can run it against any web page, public or requiring authentication. It has audits for performance, accessibility, progressive web apps, SEO and more.
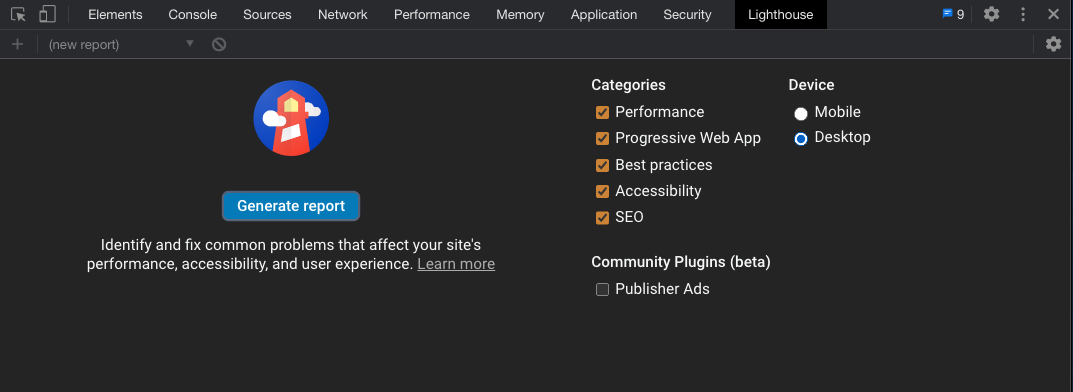
The great news is that it's also in-built into DevTools so you run an audit directly from the browsers. Lets see how the BBC News website is performing. When you hit Generate Report, you'll see all of the tests that run and will take a few minutes to complete the report.
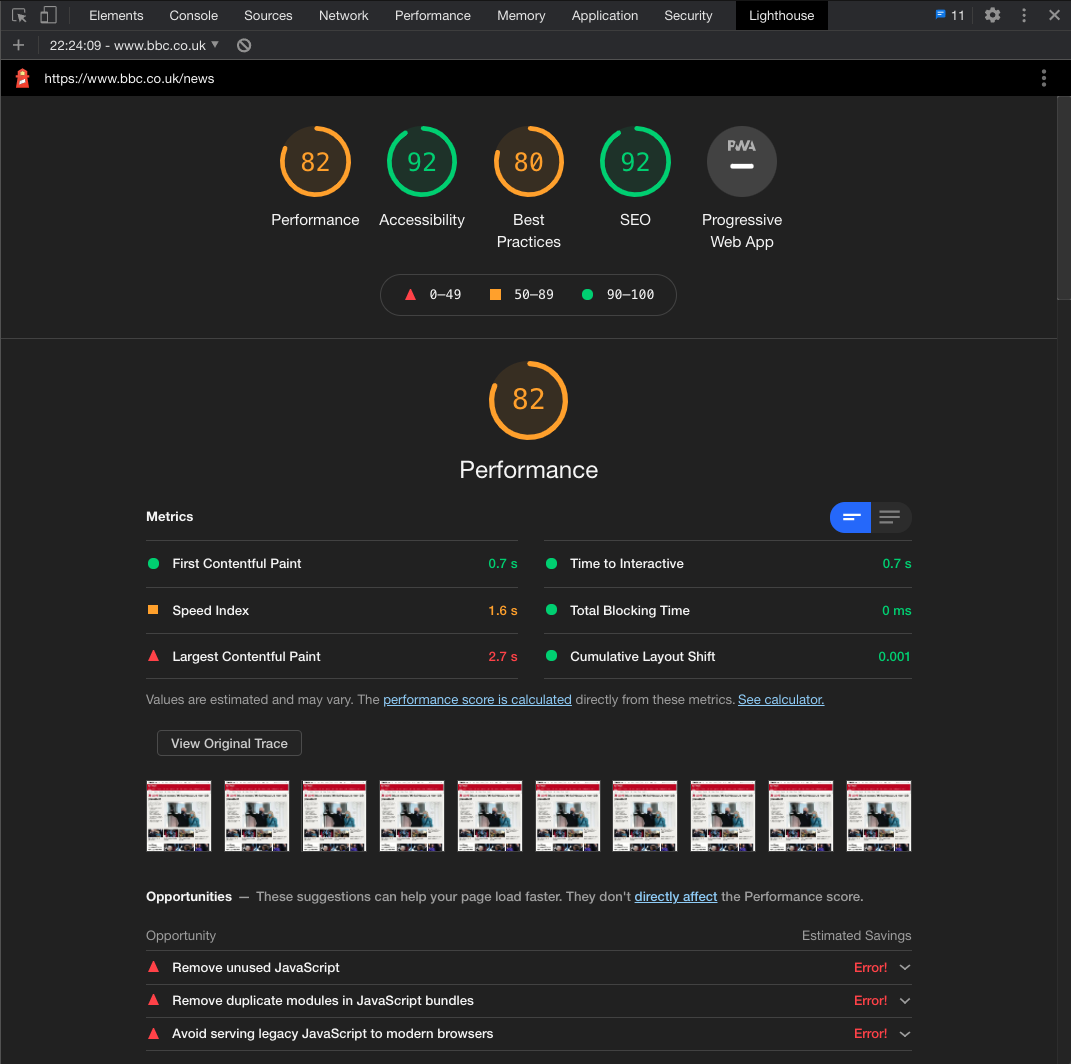
Read the report and the suggestions made, under each section you'll see some suggestions and each section explains to the developer how to fix them. When developing sites for production systems, don't aim for 100% but try and get each of the main sections to turn green.
Task 10 - Run an audit of any site you like, and also run an audit on the website and see how badly it performs. Feel free to fix any of the performance issues you find.
Well Done
Well that was a lot of information for one workshop. Well done for getting to the end.
If you want to explore more information about DevTools then there are lots of Examples and videos available at https://developers.google.com/web/tools/chrome-devtools. Go and have a look and explore but the best way of getting to know a tool is to use it.
See you all at the next session.