In this workshop you will learn:
- how to store data on a RPi gateway
- how to visualise time series data
Route 1 - PiCloud
If you are working on an allocated RPi in the CE Lab PiCloud, open up a terminal session and log in to your RPi. For example, the screenshot below shows my log in to RPi number 47 on PiCloud.
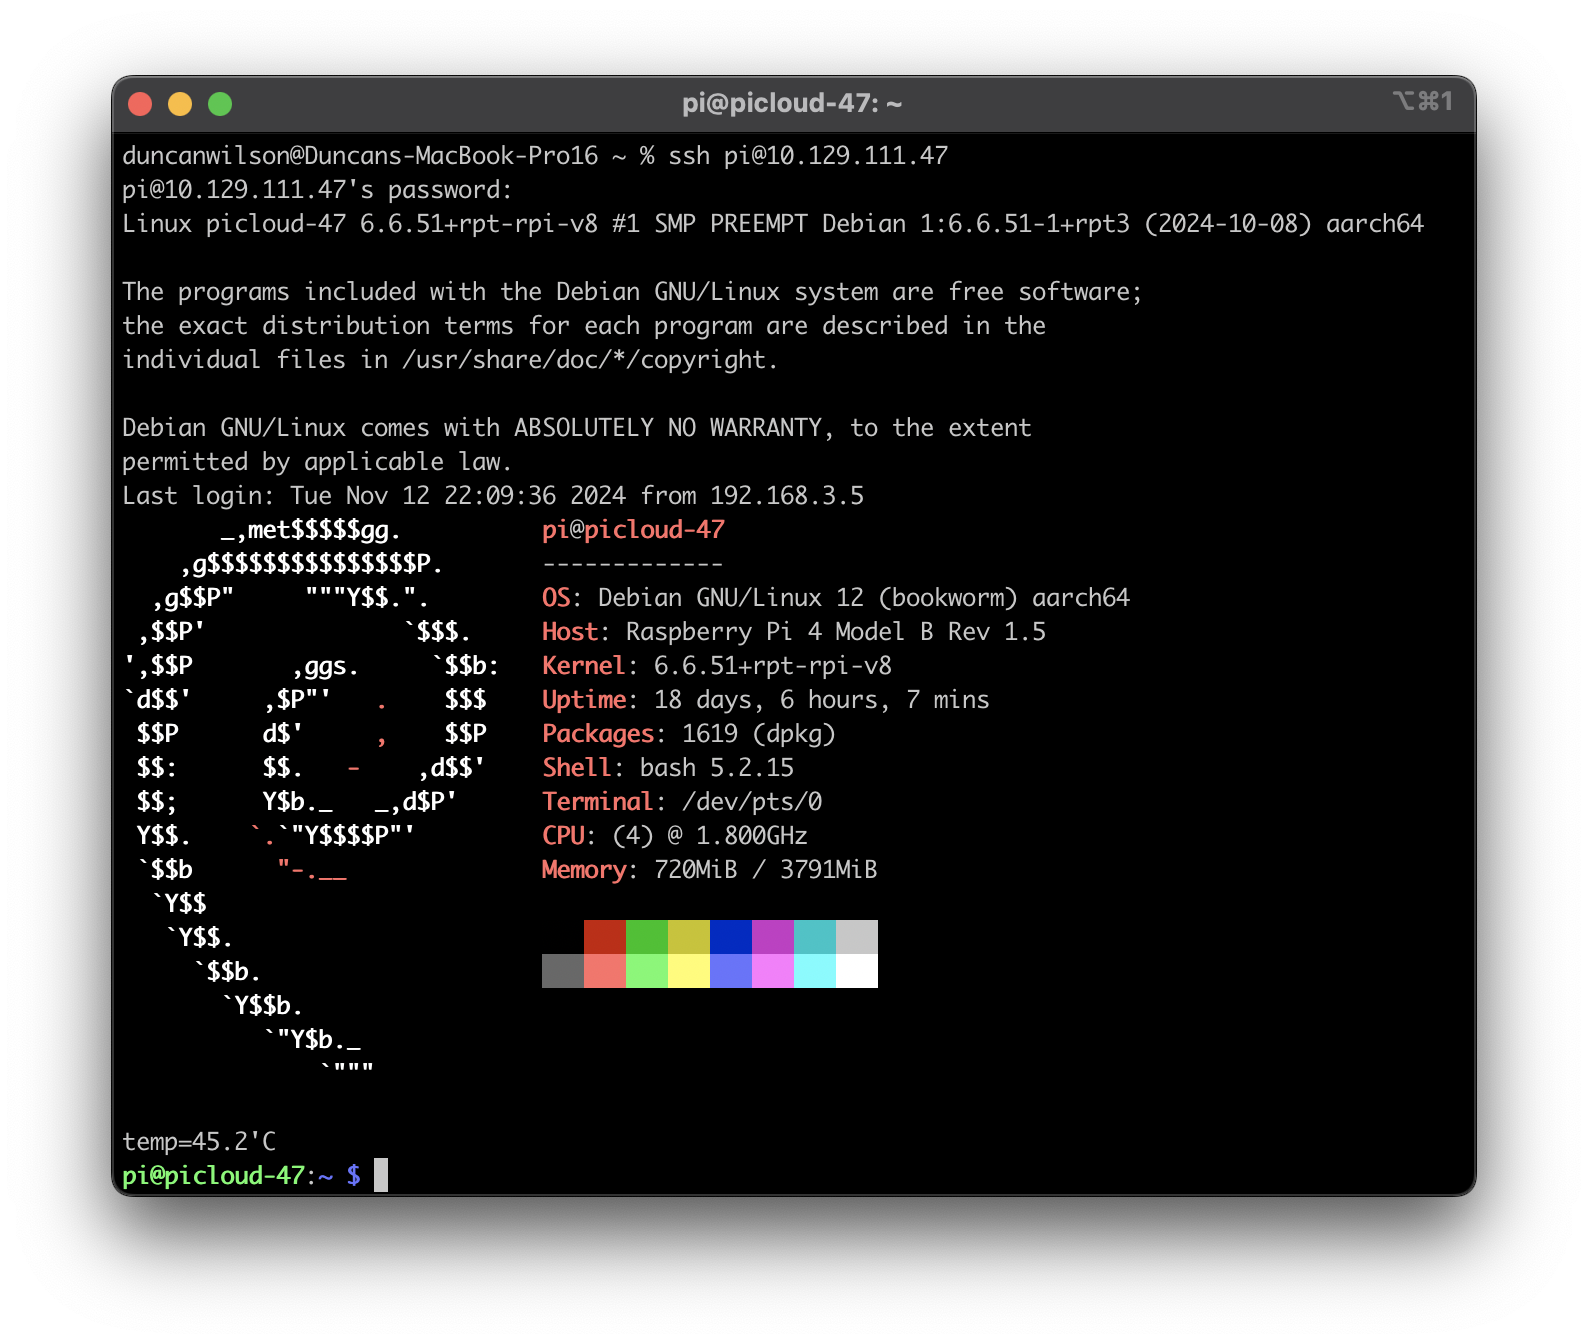
I logged in using iTerm and the following command:
ssh pi@10.129.111.47
If you completed route one, you can now move to page 3.
Route 2 - New RPi
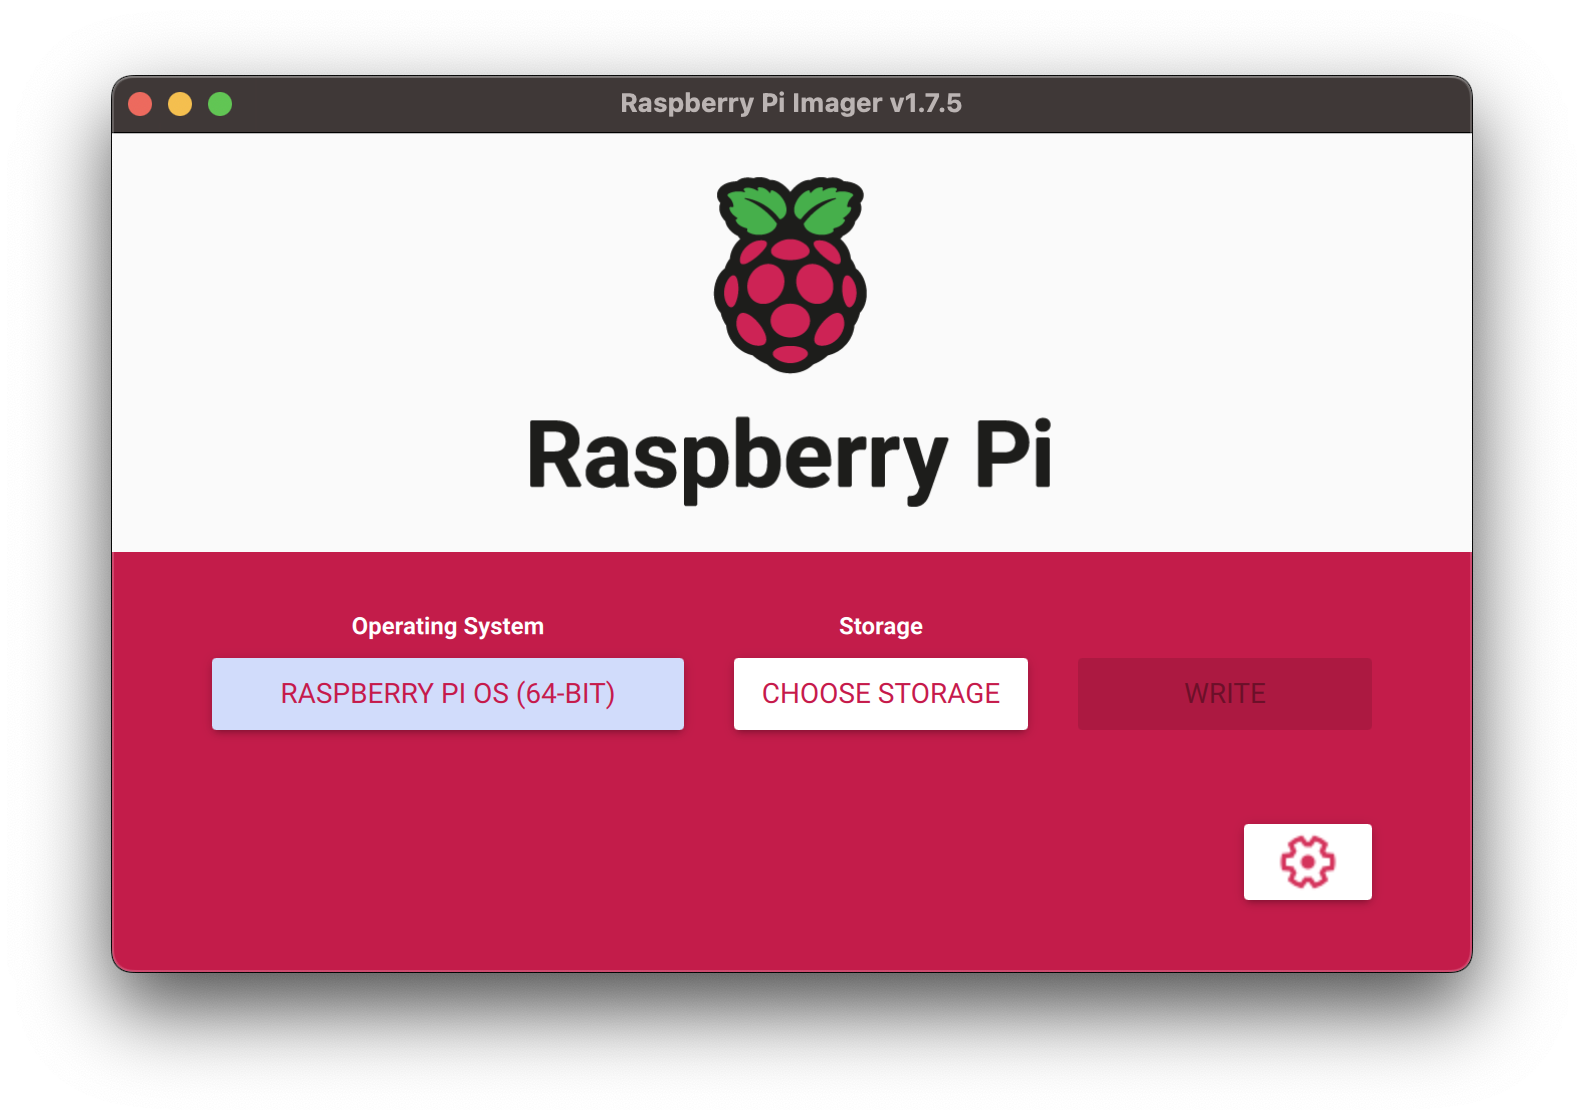
If you have bought your own RPi (we recommend a RPi 4) flash it with the latest 64bit version of Raspbian.
The Raspberry Pi website has a really simple imager to setup a Pi and there are lots of tutorials on-line to get you started configuring network settings etc. This tutorial is useful for setting up a headless device when you can plug it into a network where you don't know which IP address will be assigned.
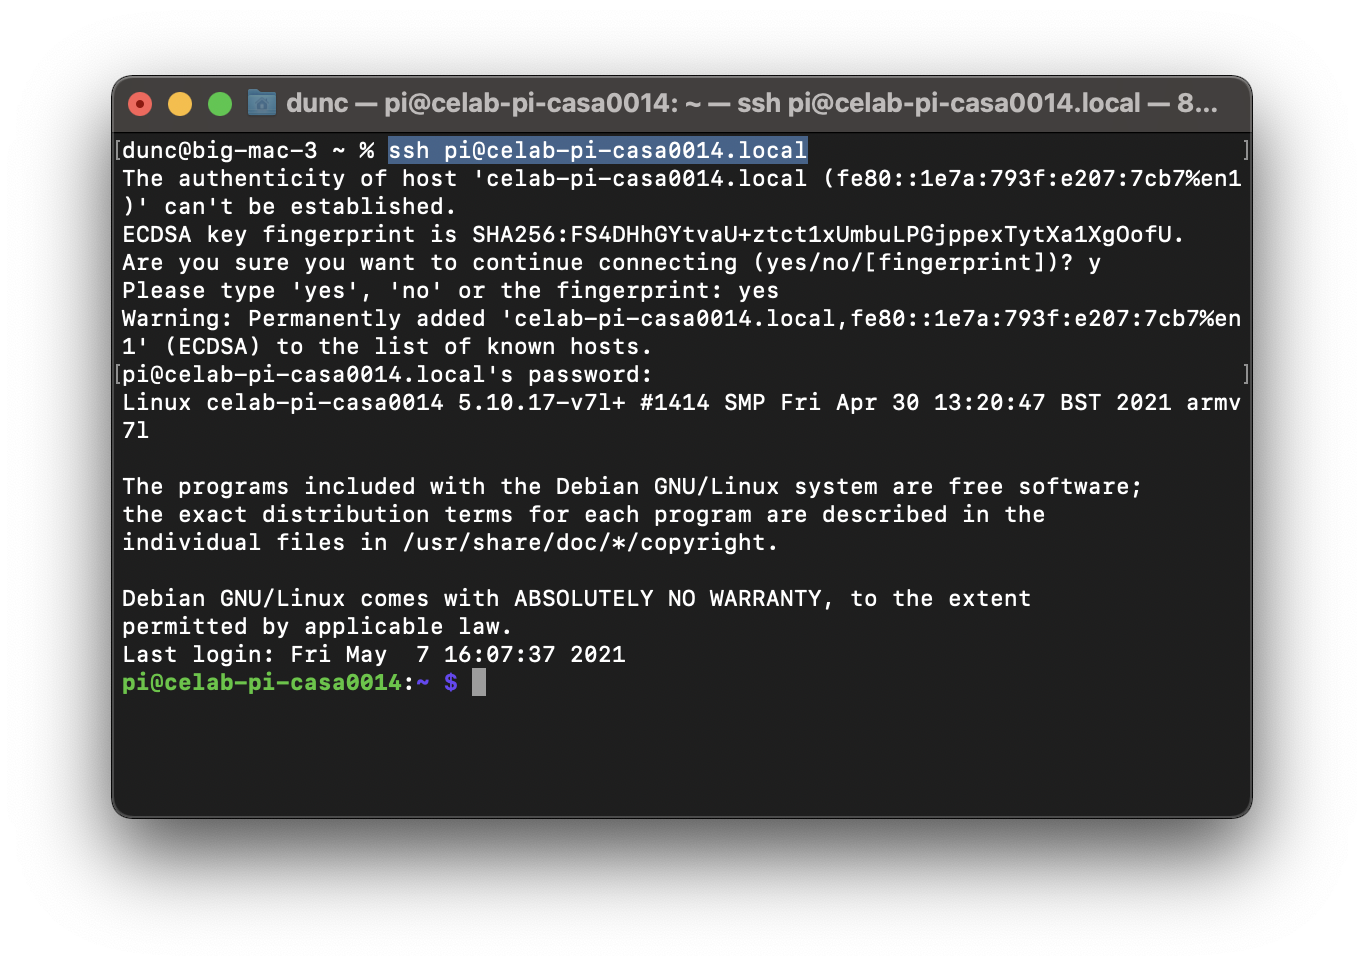
Once the card is flashed, insert it into the RPi and power it up. On your Mac / PC open up a Terminal / Putty session and log into the device using SSH. In my case i used:
ssh pi@staff-pi-casa0014.local
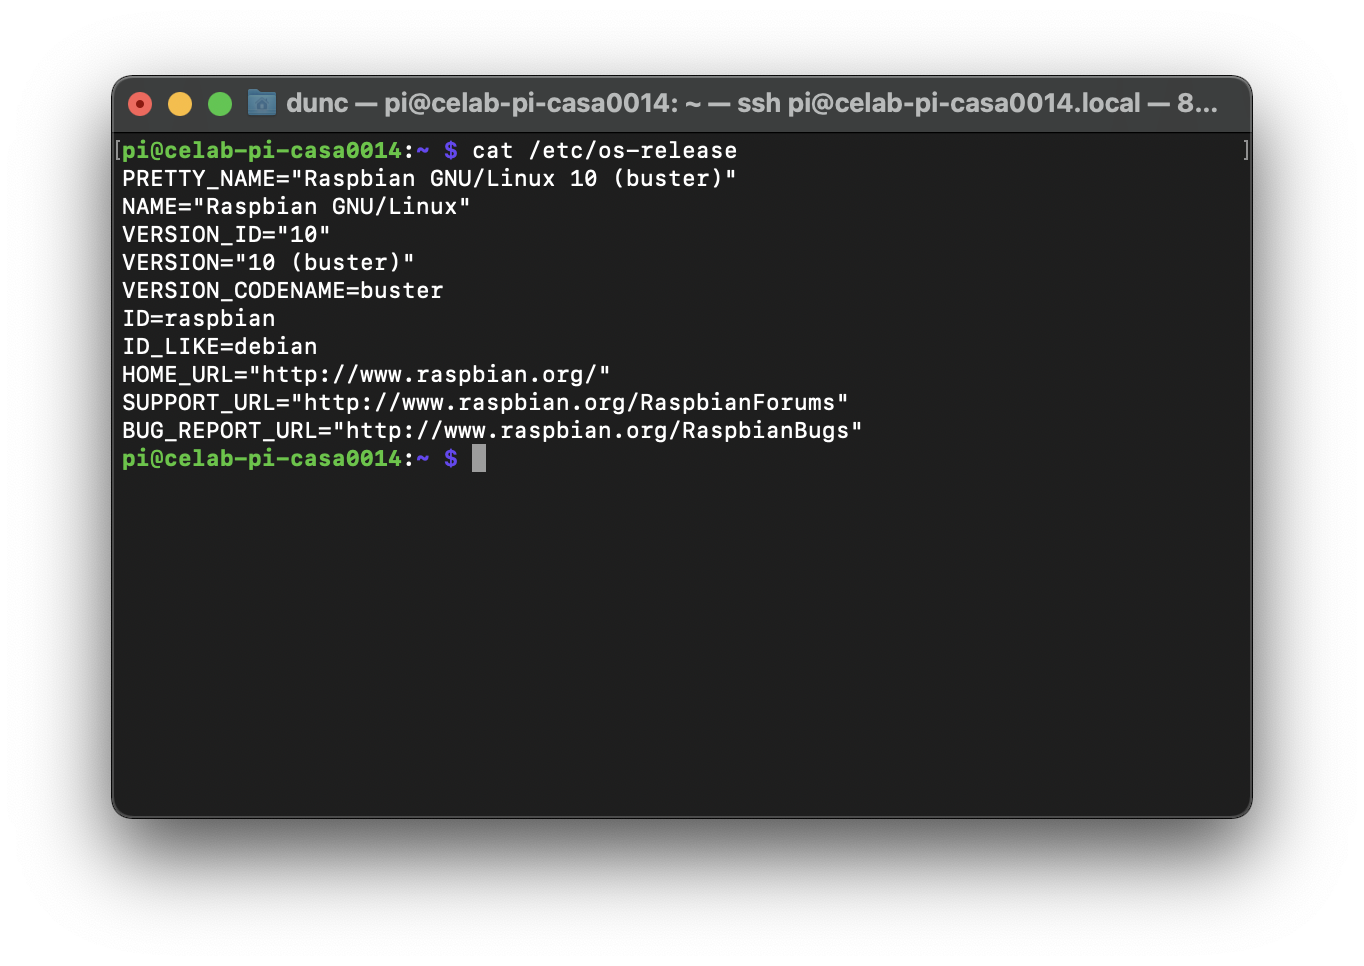
To check the OS of the device enter the following:
cat /etc/os-release
Which for me resulted in the following:
Finally do a quick update / upgrade to make sure all files are upto date and then reboot before moving on to installing the datastore.
sudo apt update
sudo apt upgrade -y
sudo reboot
Excellent, after a few minutes of updates, upgrades and a reboot you should have a shiny new RPi sitting alongside a bunch of others on the lab network. Log back into it through Terminal or Putty so that we can continue with the set-up.
If this is your first time using the command line on a computer then these interfaces will feel really weird and complex - don't panic - at this stage we just want you to follow along with the workshop - ask for help from tutors if you are completely lost. We can also organise some skills sessions to cover some of these topics if there is interest. We have found this Missing Module resource from CS department at MIT really useful! Is worth taking a look if you want to get a gentle introduction.
InfluxDB downloads are available here. You can ignore the cloud sign up or join the free tier - your choice. Cancel the cloud signup pop up. We will use v2 (hence the requirement for a 64bit OS). You should see information similar to below for the downloads - but we will install from the command line on the RPi. We will use the Ubuntu & Debian (Arm 64-bit) option. (Note: the notes below are based on the official influxdata website notes)
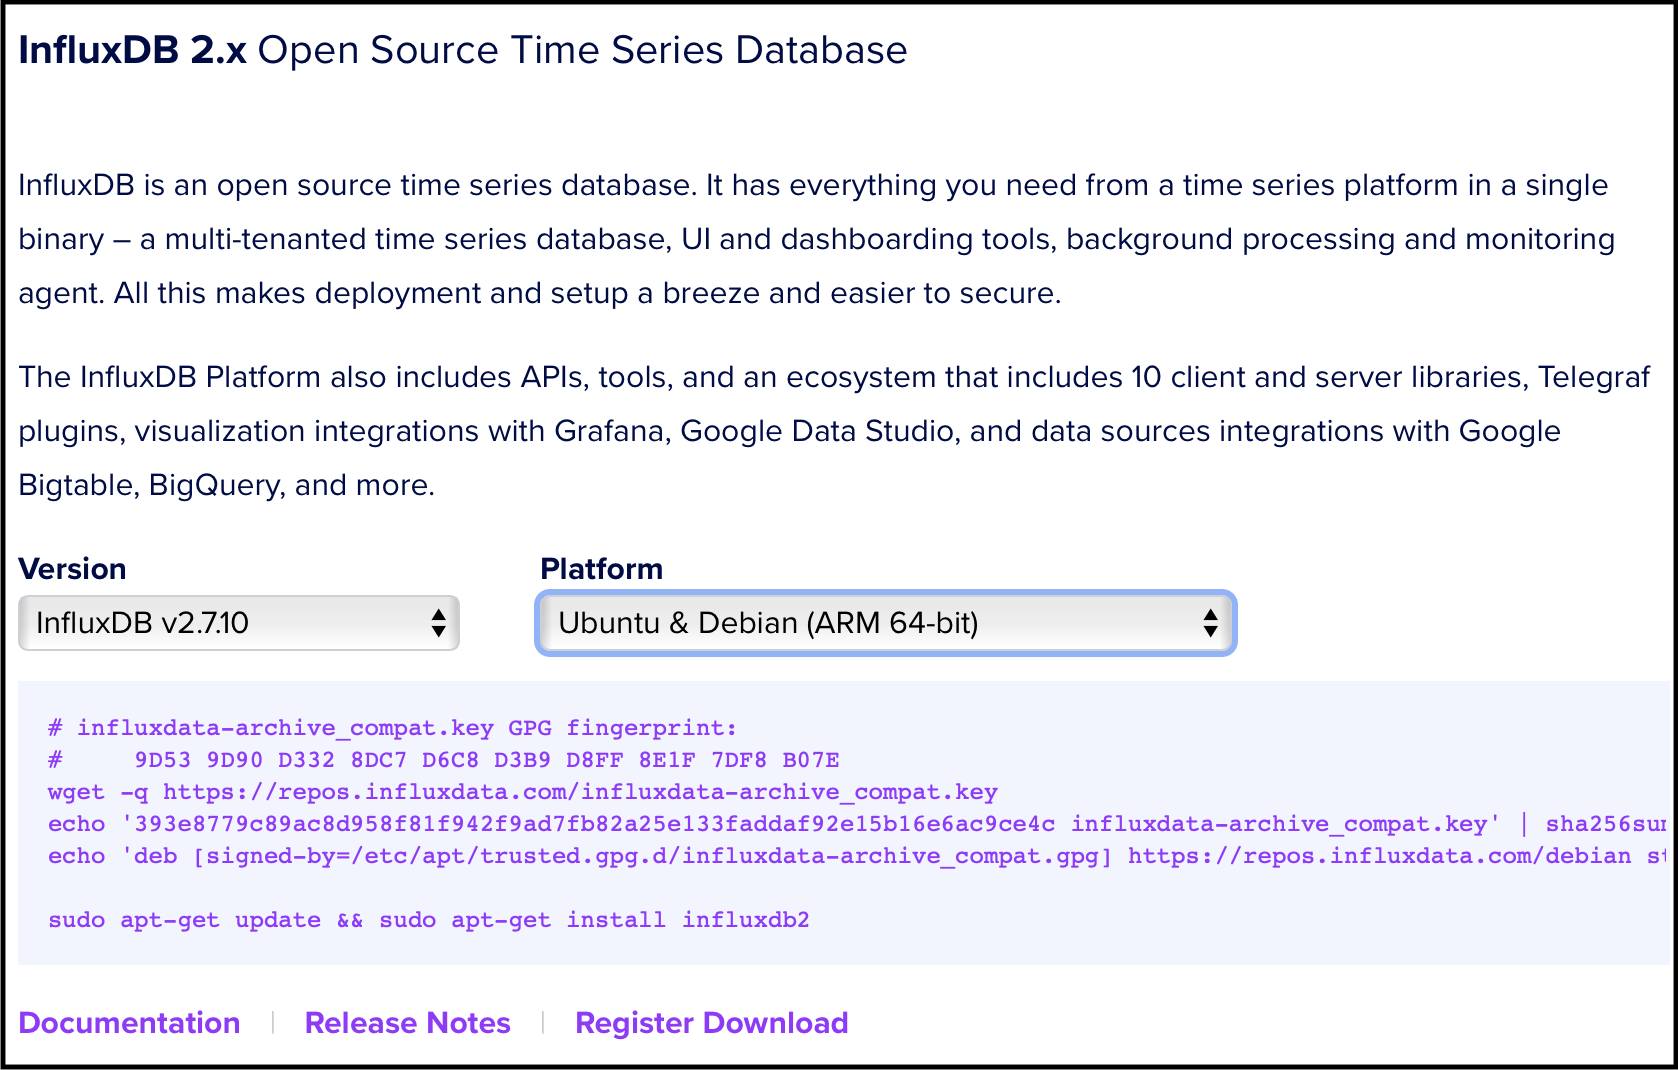
Install using the process below:
1] Add the InfluxDB key to ensure secure download and the repository to the sources list so that we can download it in the next step.
wget -q https://repos.influxdata.com/influxdata-archive_compat.key
echo '393e8779c89ac8d958f81f942f9ad7fb82a25e133faddaf92e15b16e6ac9ce4c influxdata-archive_compat.key' | sha256sum -c && cat influxdata-archive_compat.key | gpg --dearmor | sudo tee /etc/apt/trusted.gpg.d/influxdata-archive_compat.gpg > /dev/null
echo 'deb [signed-by=/etc/apt/trusted.gpg.d/influxdata-archive_compat.gpg] https://repos.influxdata.com/debian stable main' | sudo tee /etc/apt/sources.list.d/influxdata.list
2] With the repository added we now run another update to the package list
sudo apt-get update
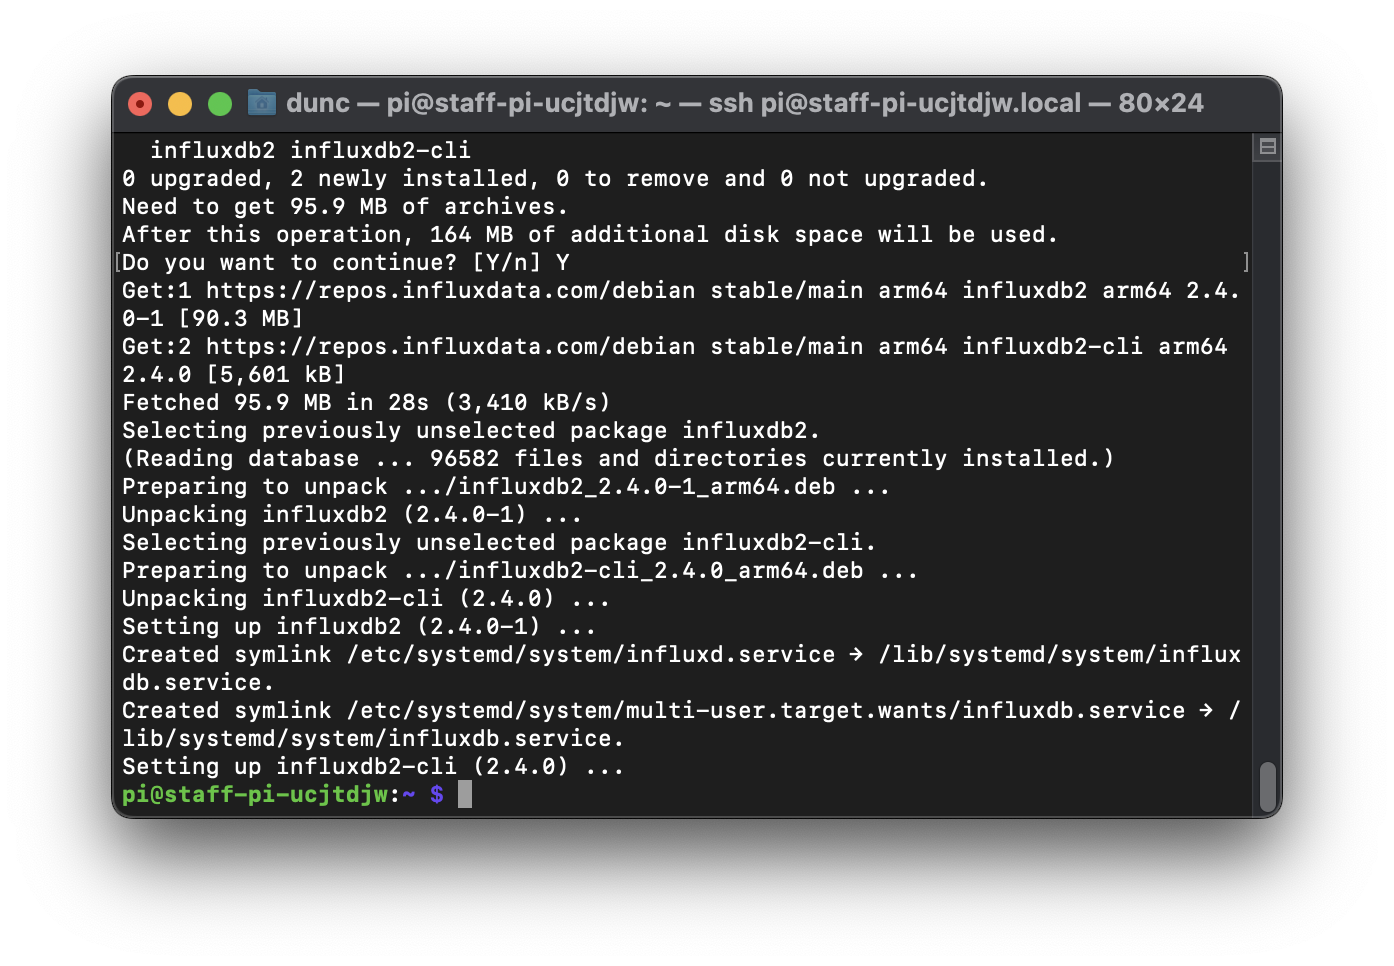
3] Finally we install InfluxDB
sudo apt-get install influxdb2 -y
This should result in an output similar to that in the image below:
Finally to get InfluxDB up and running at reboot we need to enable and start it within systemctl:
sudo systemctl unmask influxdb.service
sudo systemctl start influxdb
sudo systemctl enable influxdb.service
You can check if it is running ok with:
sudo systemctl status influxdb
Use CTRL C to break out of the systemctl command and get back to the terminal prompt.
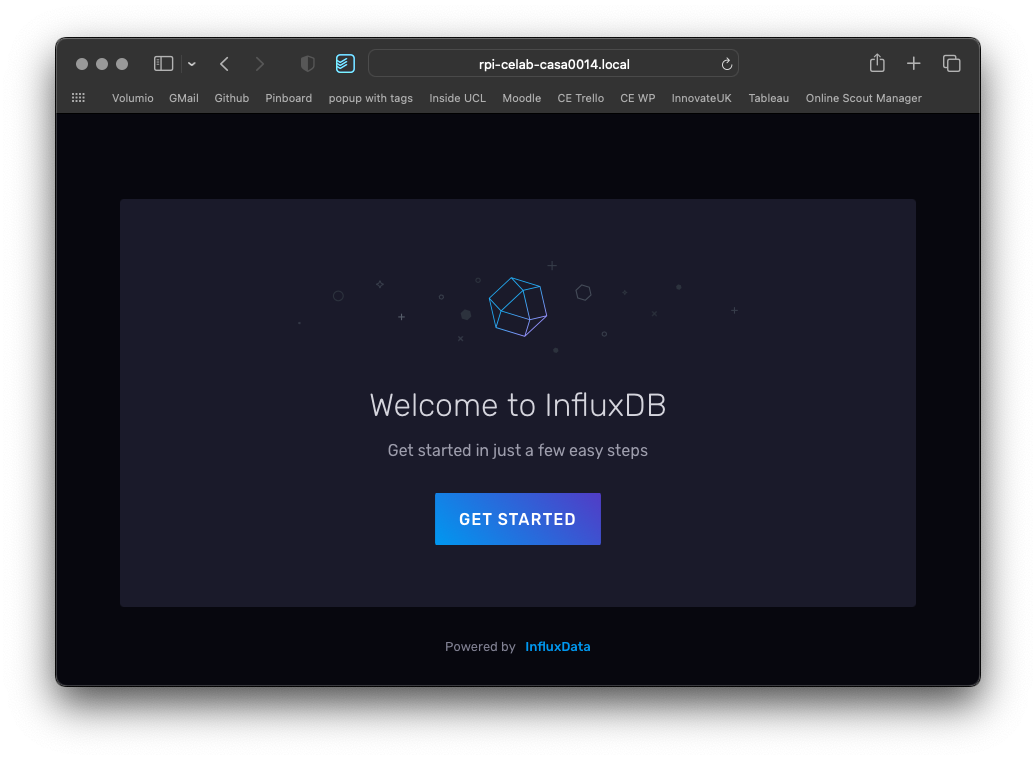
You should now be able to browse to your instance of InfluxDB running on your machine - in my case I browse to http://10.129.111.47:8086/
To get started fill out form - use your UCL username, remember the password you use, for organisation you can use casa0014 and for the initial bucket name use telegraf.
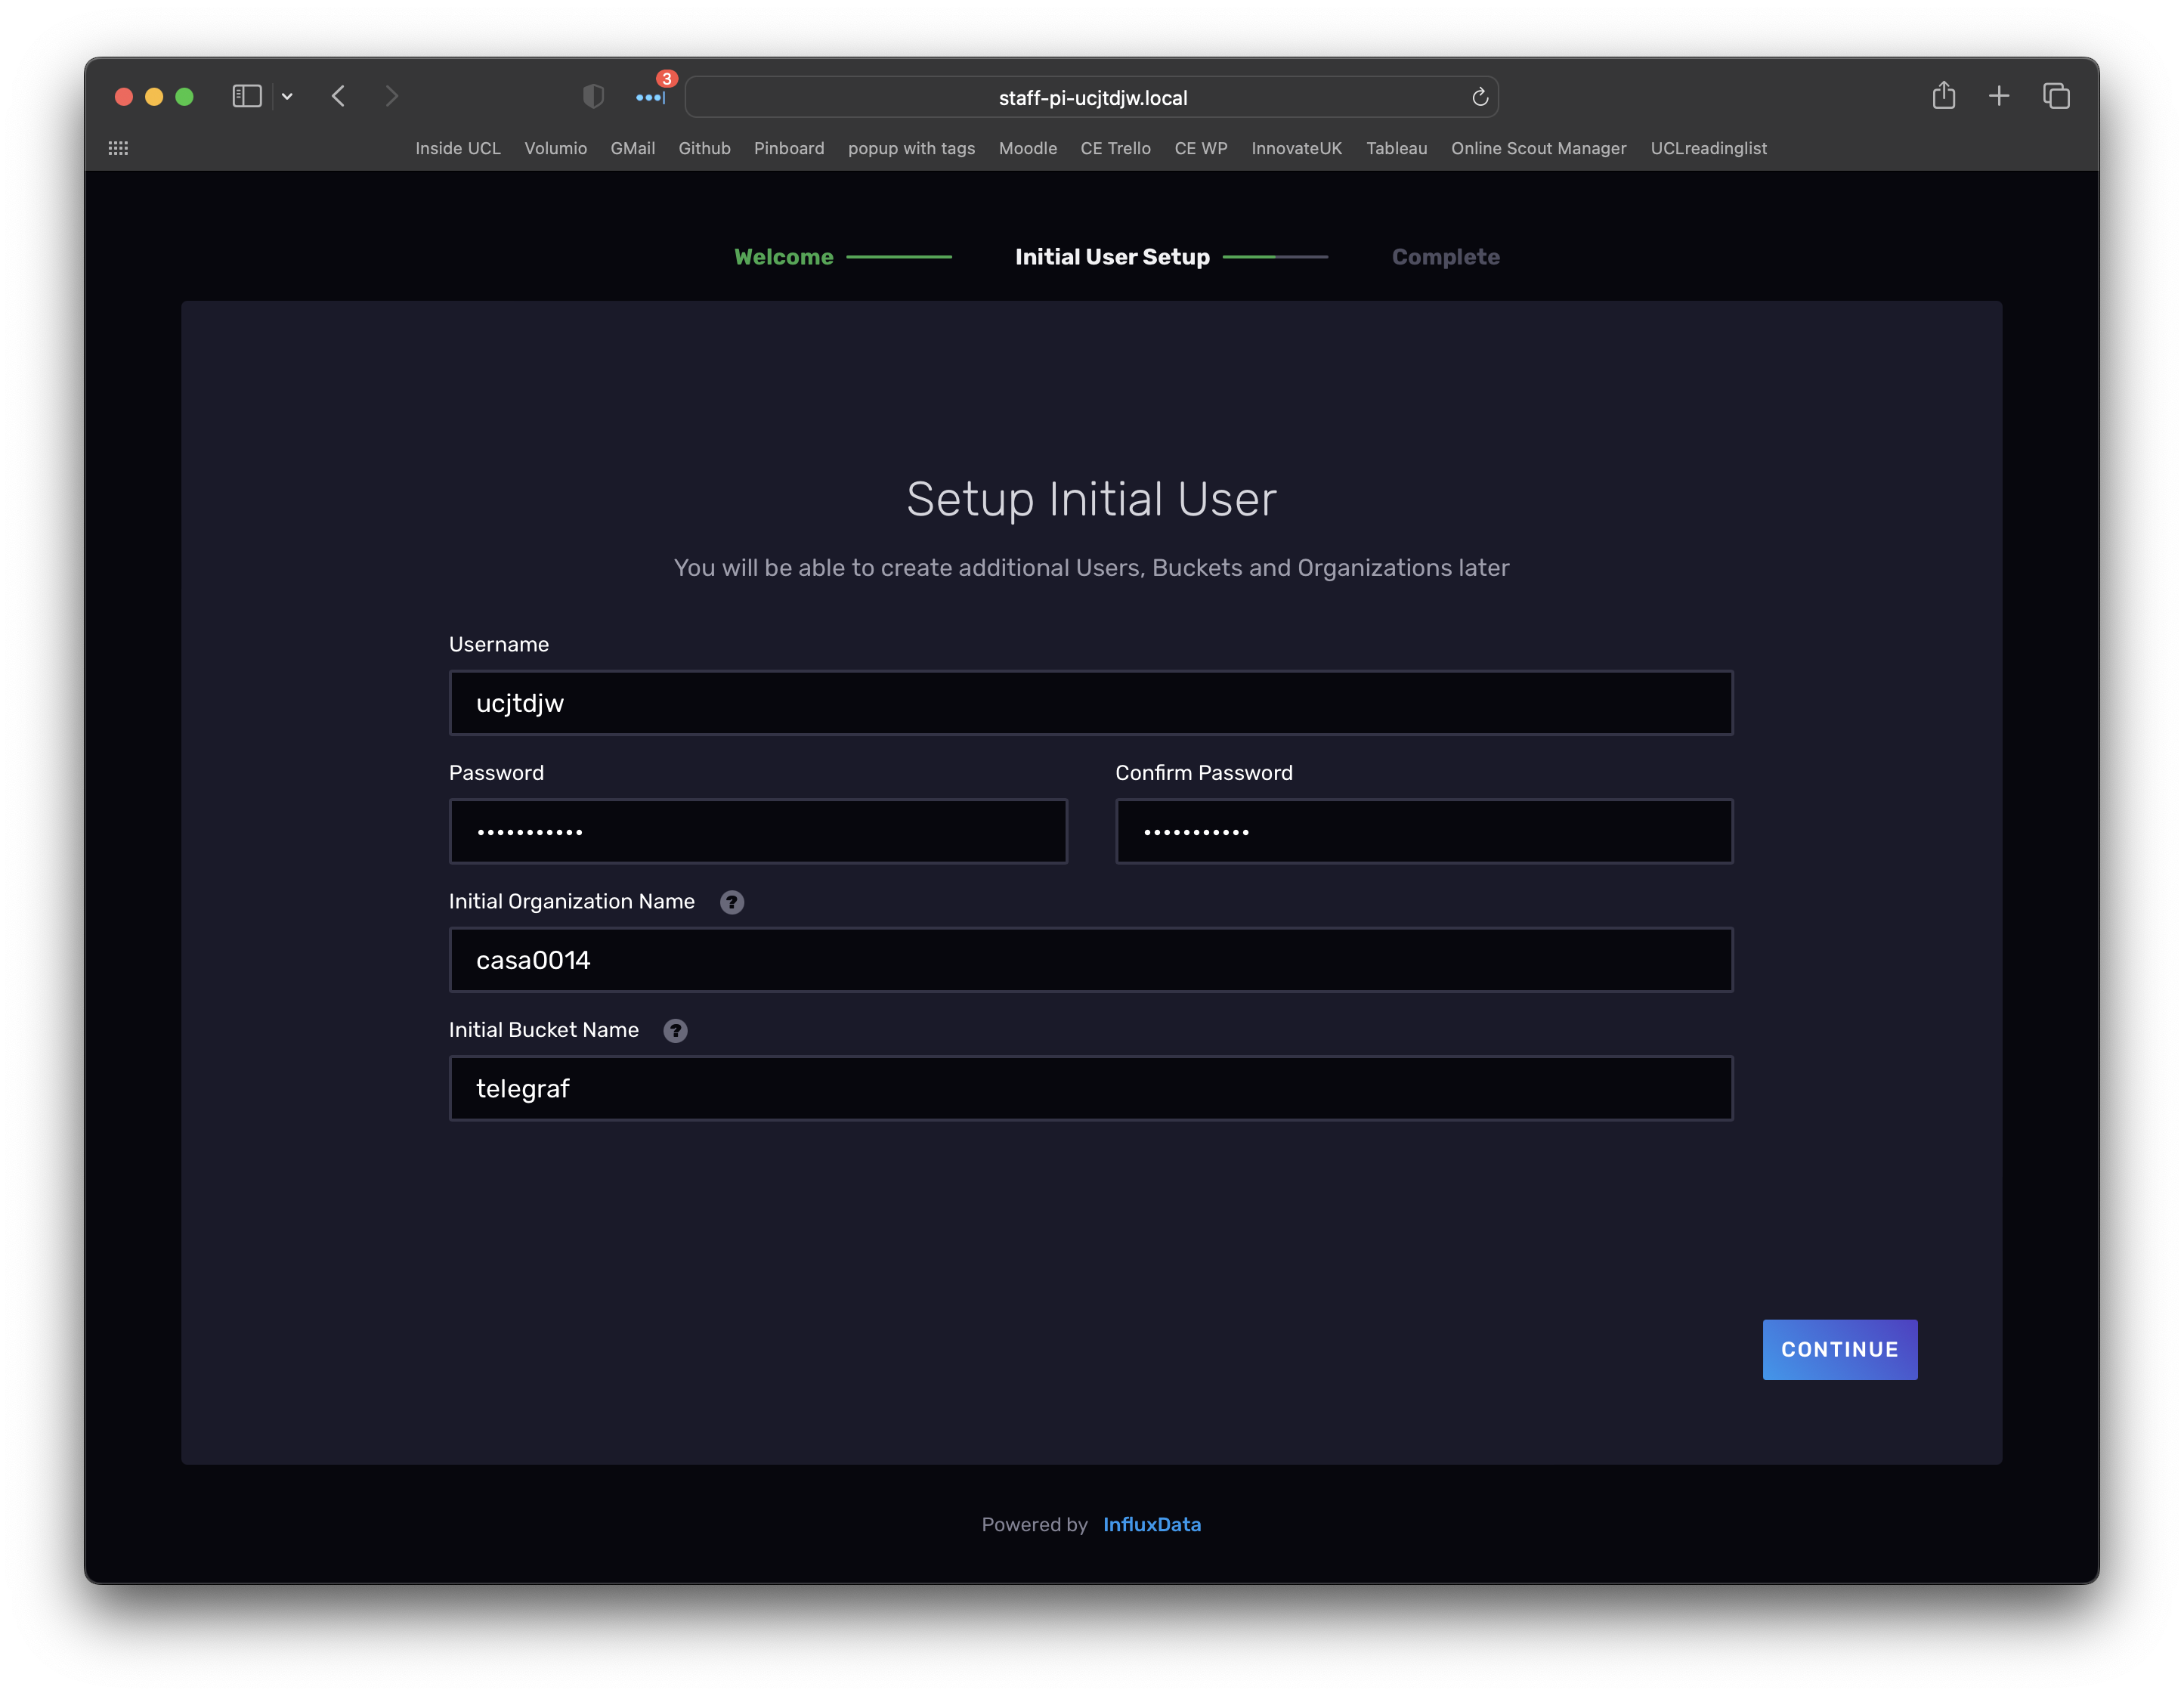
Click continue and make sure to note down your operator API token.
Then select quick start and you should see:
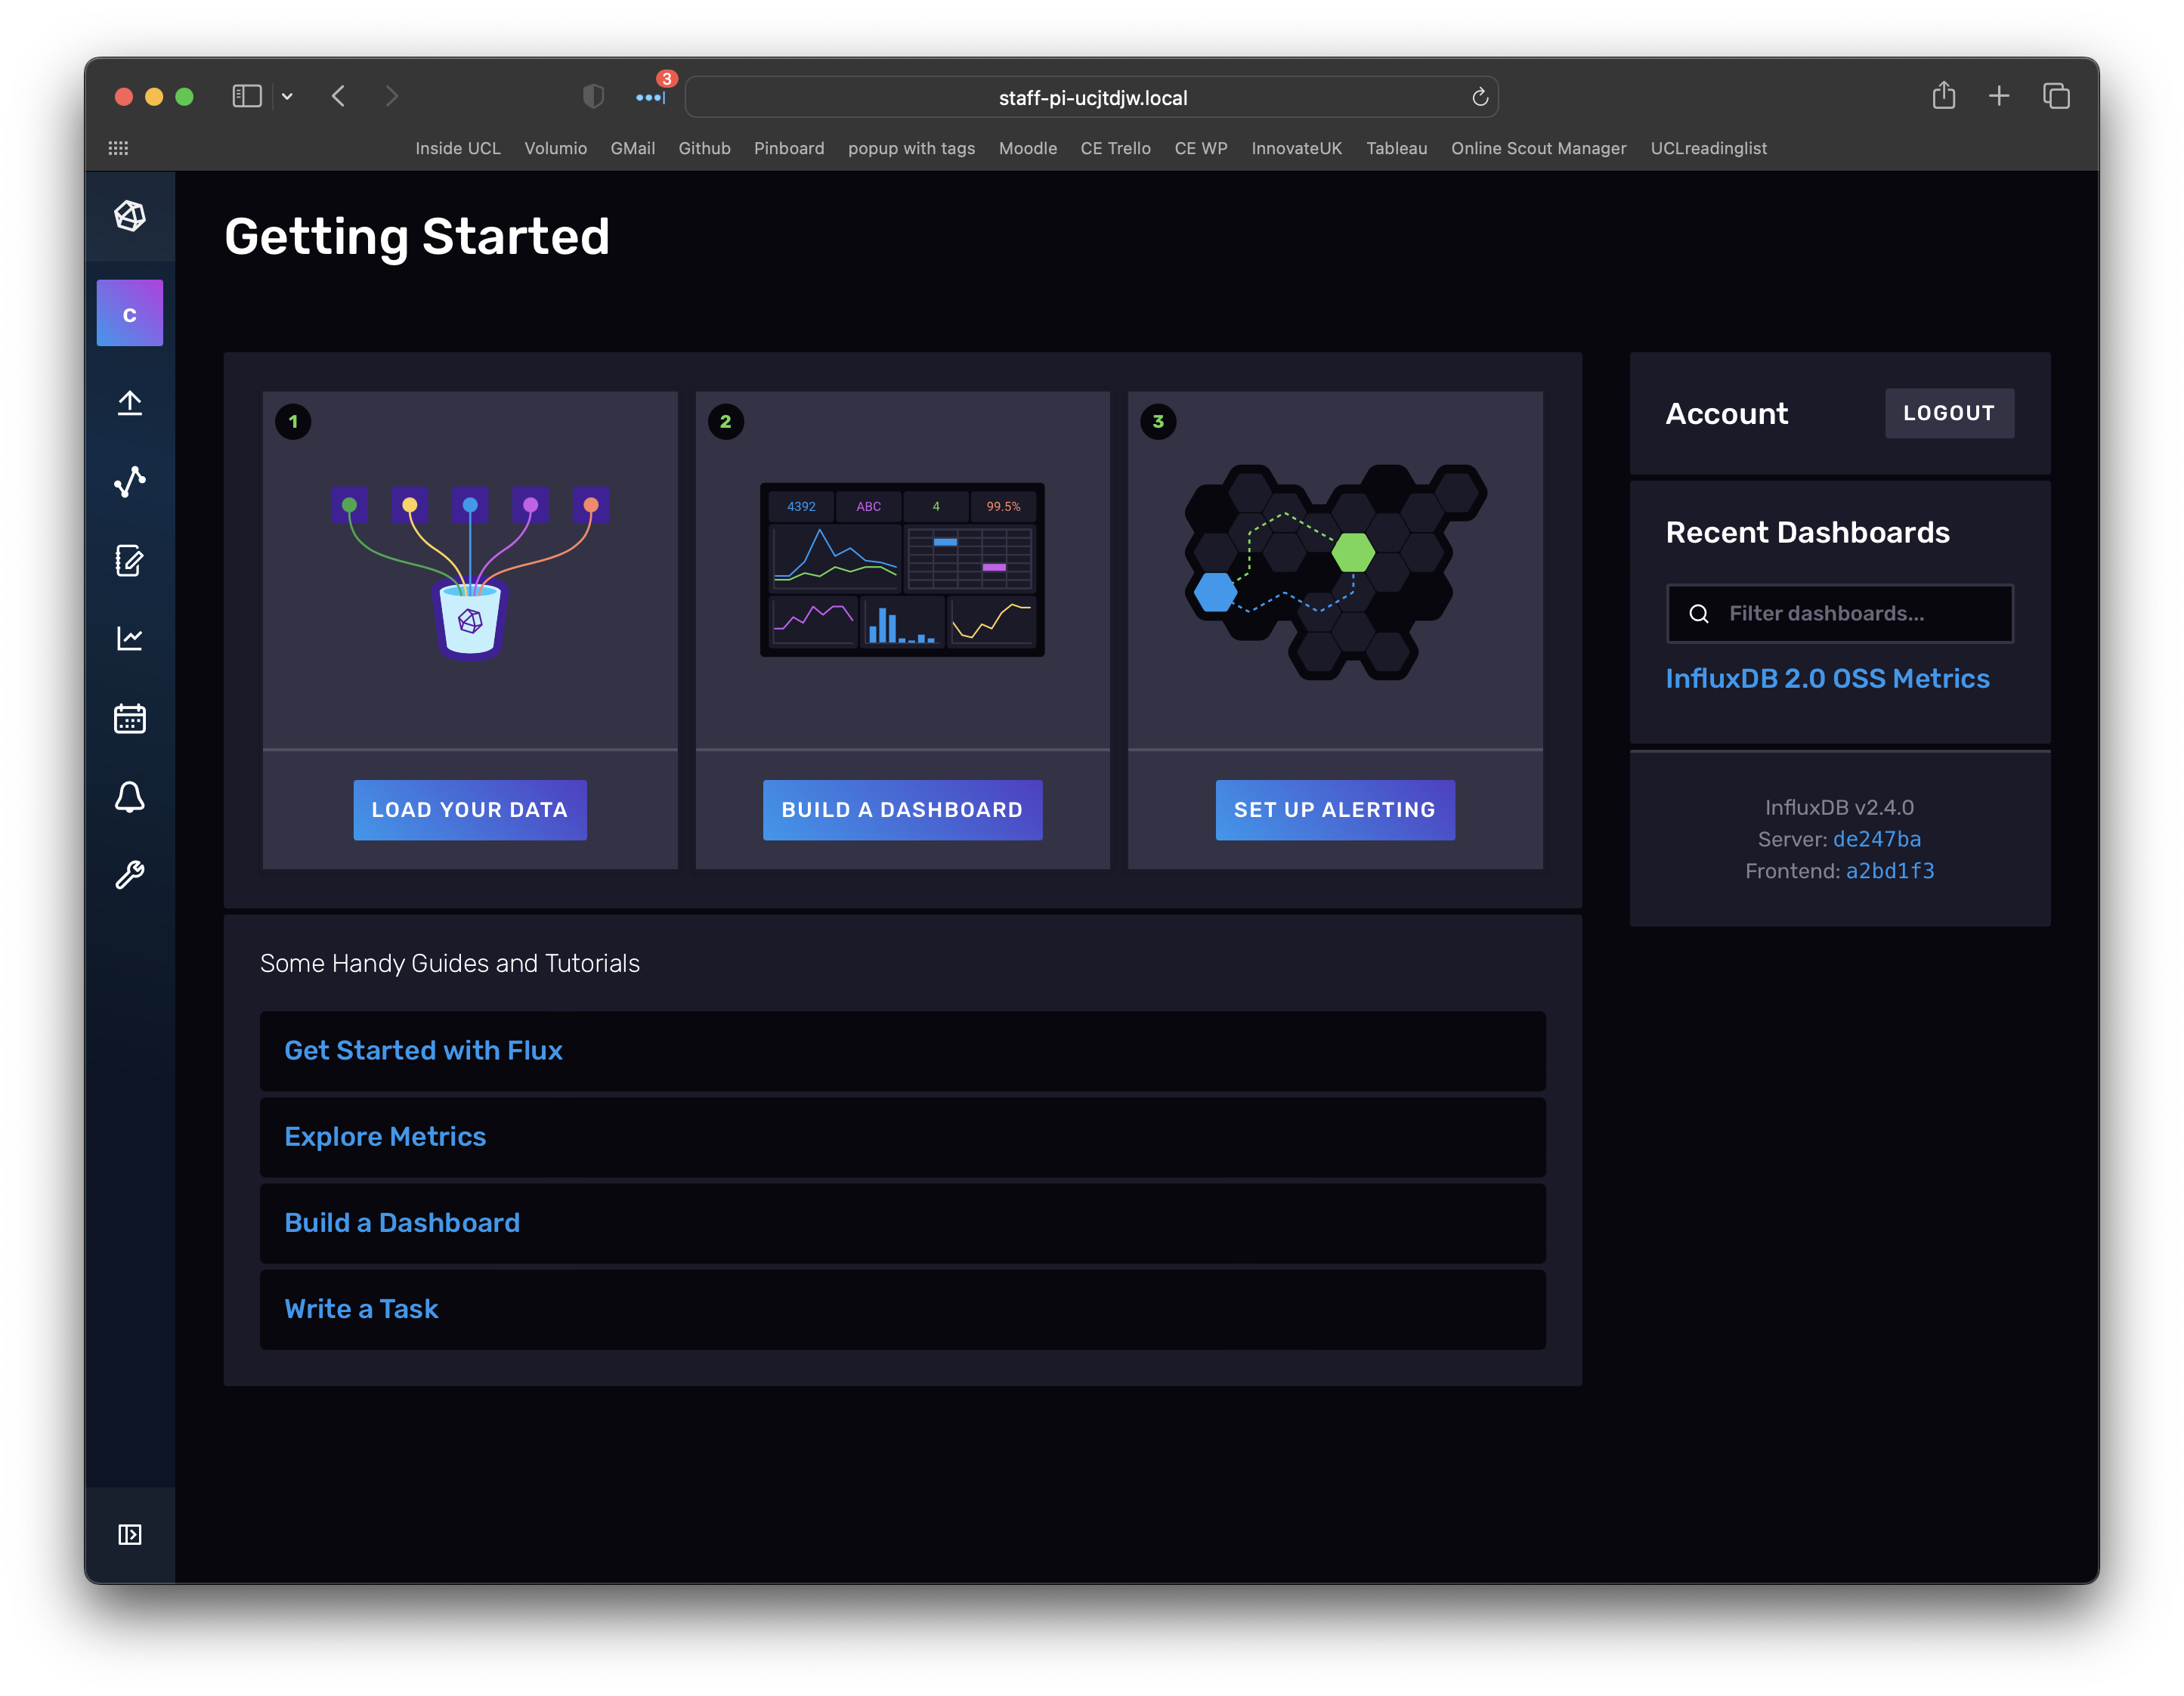
One of the great things about InfluxDB is that lots of folk are essentially building similar set-ups which mean that templates are starting to appear that do lots of the heavy lifting of setting up a system. To get started we will use a built in template for creating a datastore and dashboard for stats on the RPi system performance.
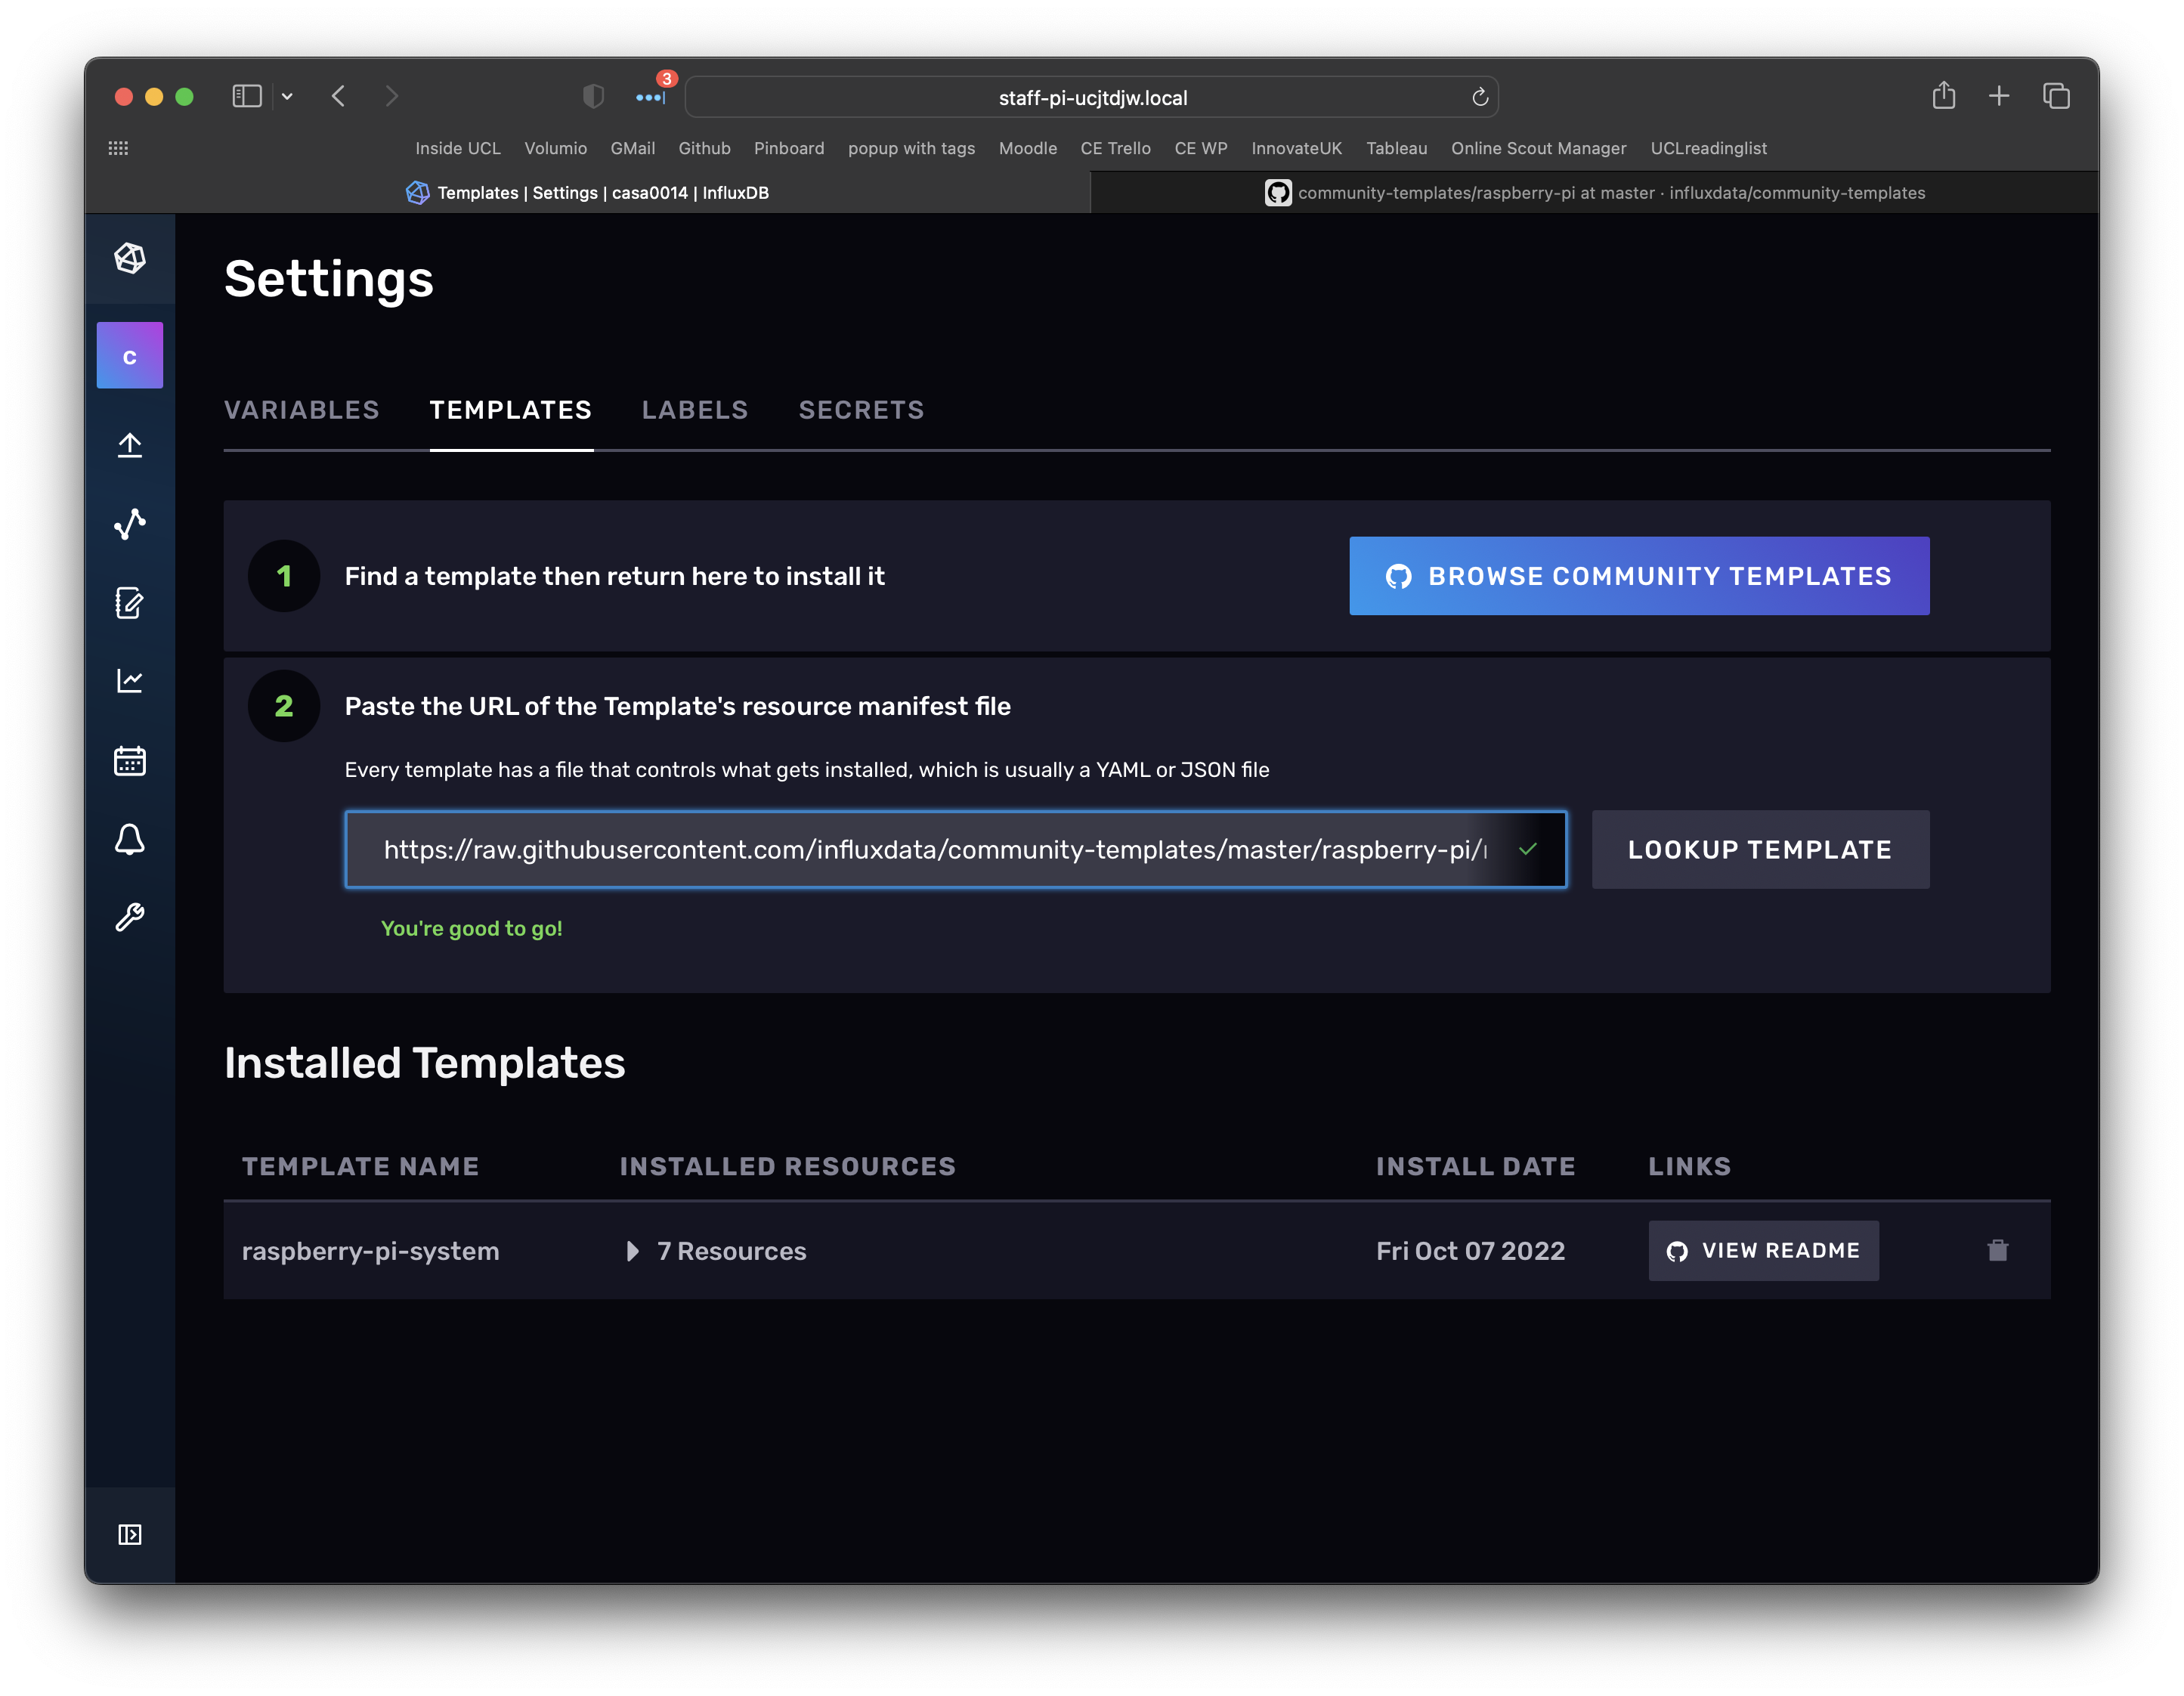
Open up the settings page ("cog" in left menu) and then select the Templates tab. From here you can look up a template for "Raspberry Pi". Click on install template. Note: we are just setting up the database to store data here - we have not started collecting data yet - we will see the template in action in a few steps time.
Telegraf is a time-series data collector - lots of information is available on the influxdata documentation site. They have some really thorough examples and teaching materials if you want to dig deeper into the functionality - it is a very powerful tool. The best way to learn what it can do is to setup some simple examples. These patterns are how we have configured the CE server infrastructure.
Step 1
Get back to the terminal on the RPi and install telegraf using the following command:
sudo apt-get update && sudo apt-get install telegraf -y
Step 2
Telegraf has lots of configuration options - the default file can be viewed at:
cat /etc/telegraf/telegraf.conf
This file has hundreds of lines so don't worry too much about the contents. To get started we will use a minimal CE setup so that you can see the basic elements of a configuration. But first we will explore data from the RPi template we installed in the previous step to see how the telegraf scripts work.
First up, define some PATH variables:
export INFLUX_HOST=http://10.129.101.214:8086
export INFLUX_ORG=casa0014
Next browse to Load Data and select Telegraf on the InfluxDB webpage.
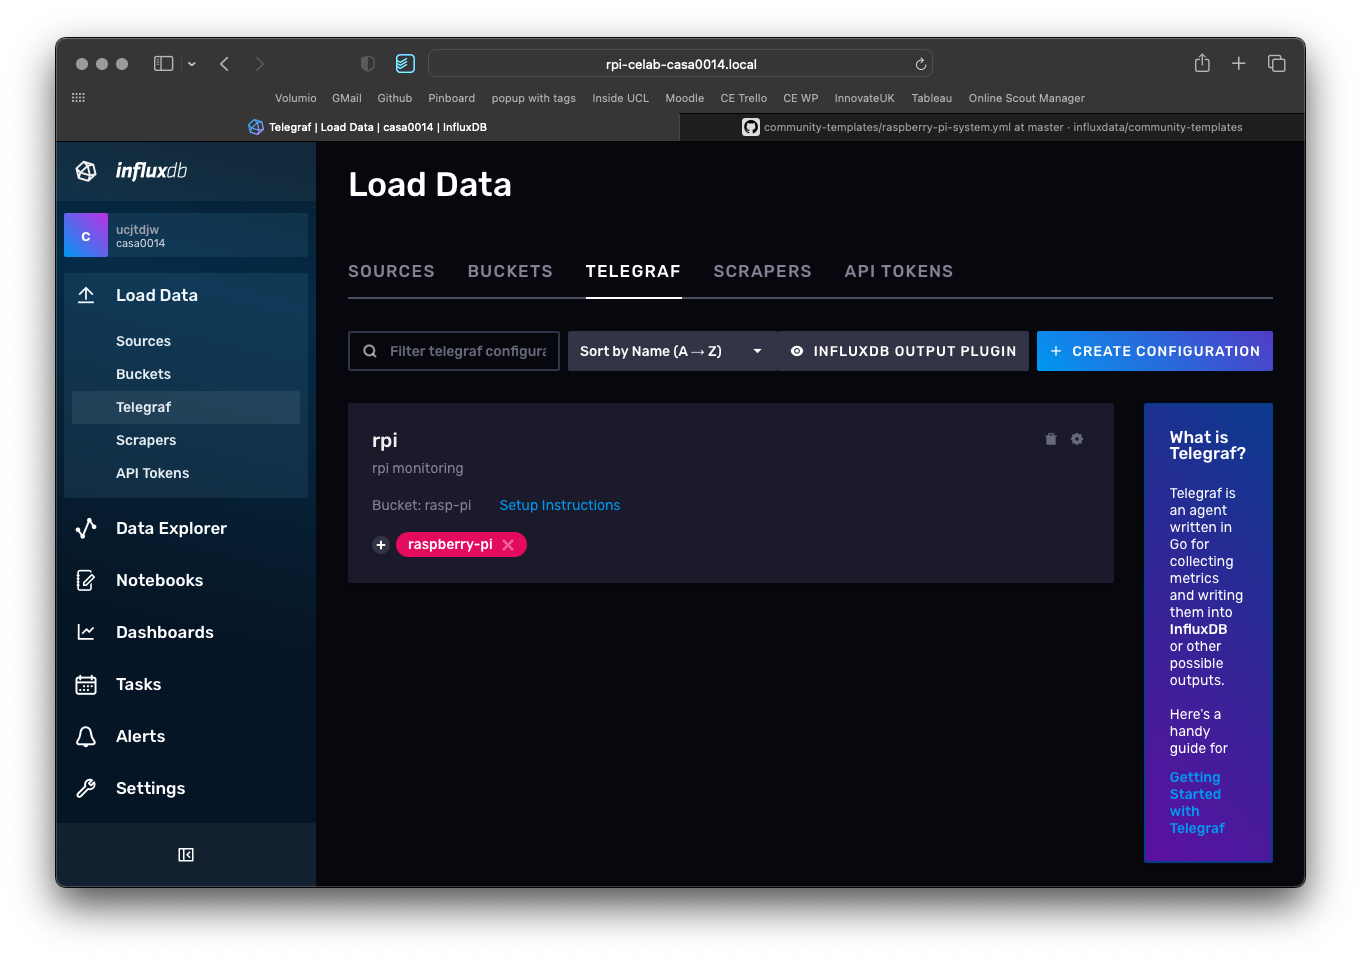
Then click on Setup instructions. You have already completed step 1 (install telegraf) but will need to do a couple of additional steps and then complete steps 2 and 3 on the command line by copy and pasting text in to the SSH shell on the RPi.
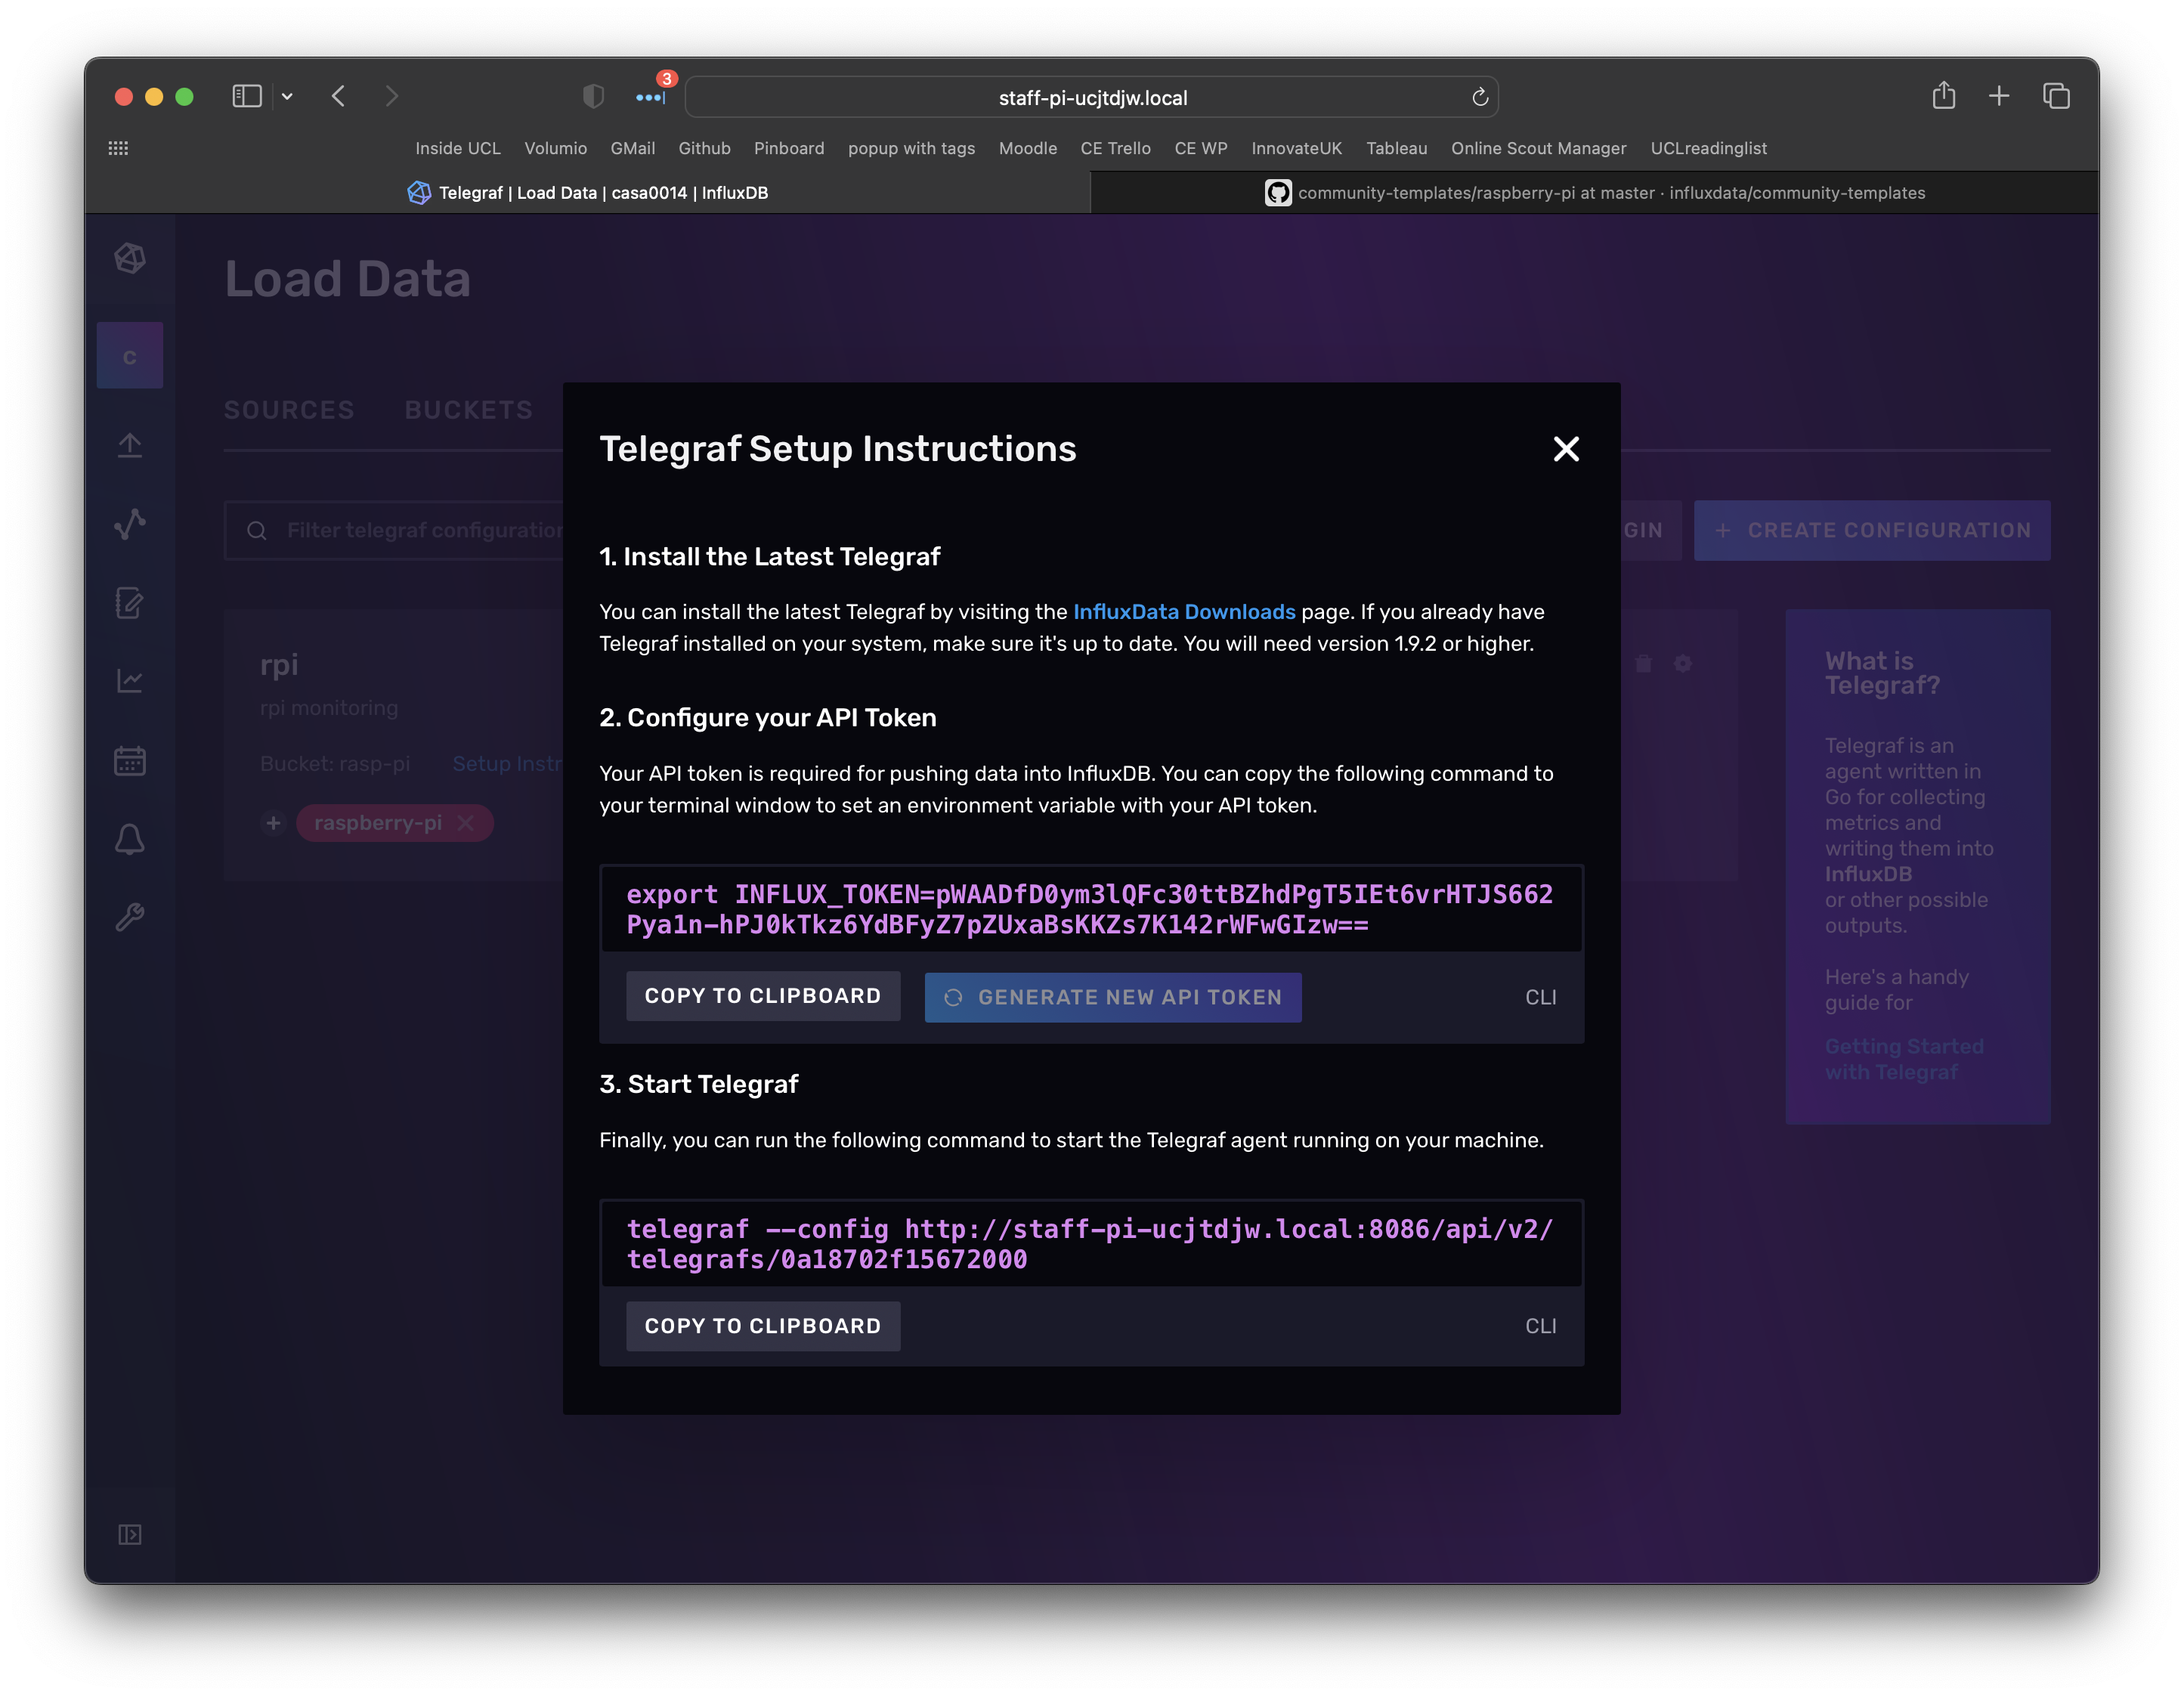
The third PATH variable you need to set is the TOKEN to get access to the Bucket. This is described in step 2 of the screenshot below. Click generate new API token and then copy and paste that into the command line.
export INFLUX_TOKEN=---you-will-have-your-own-token-here---
Finally you need to run telegraf and pass in the configuration file it needs to use - again we need to edit the command to replace the hostname with the IP address. I used:
telegraf --config http://10.129.101.214:8086/api/v2/telegrafs/0a2093eea36cb000
The terminal should now show a telegraf script running as per below:
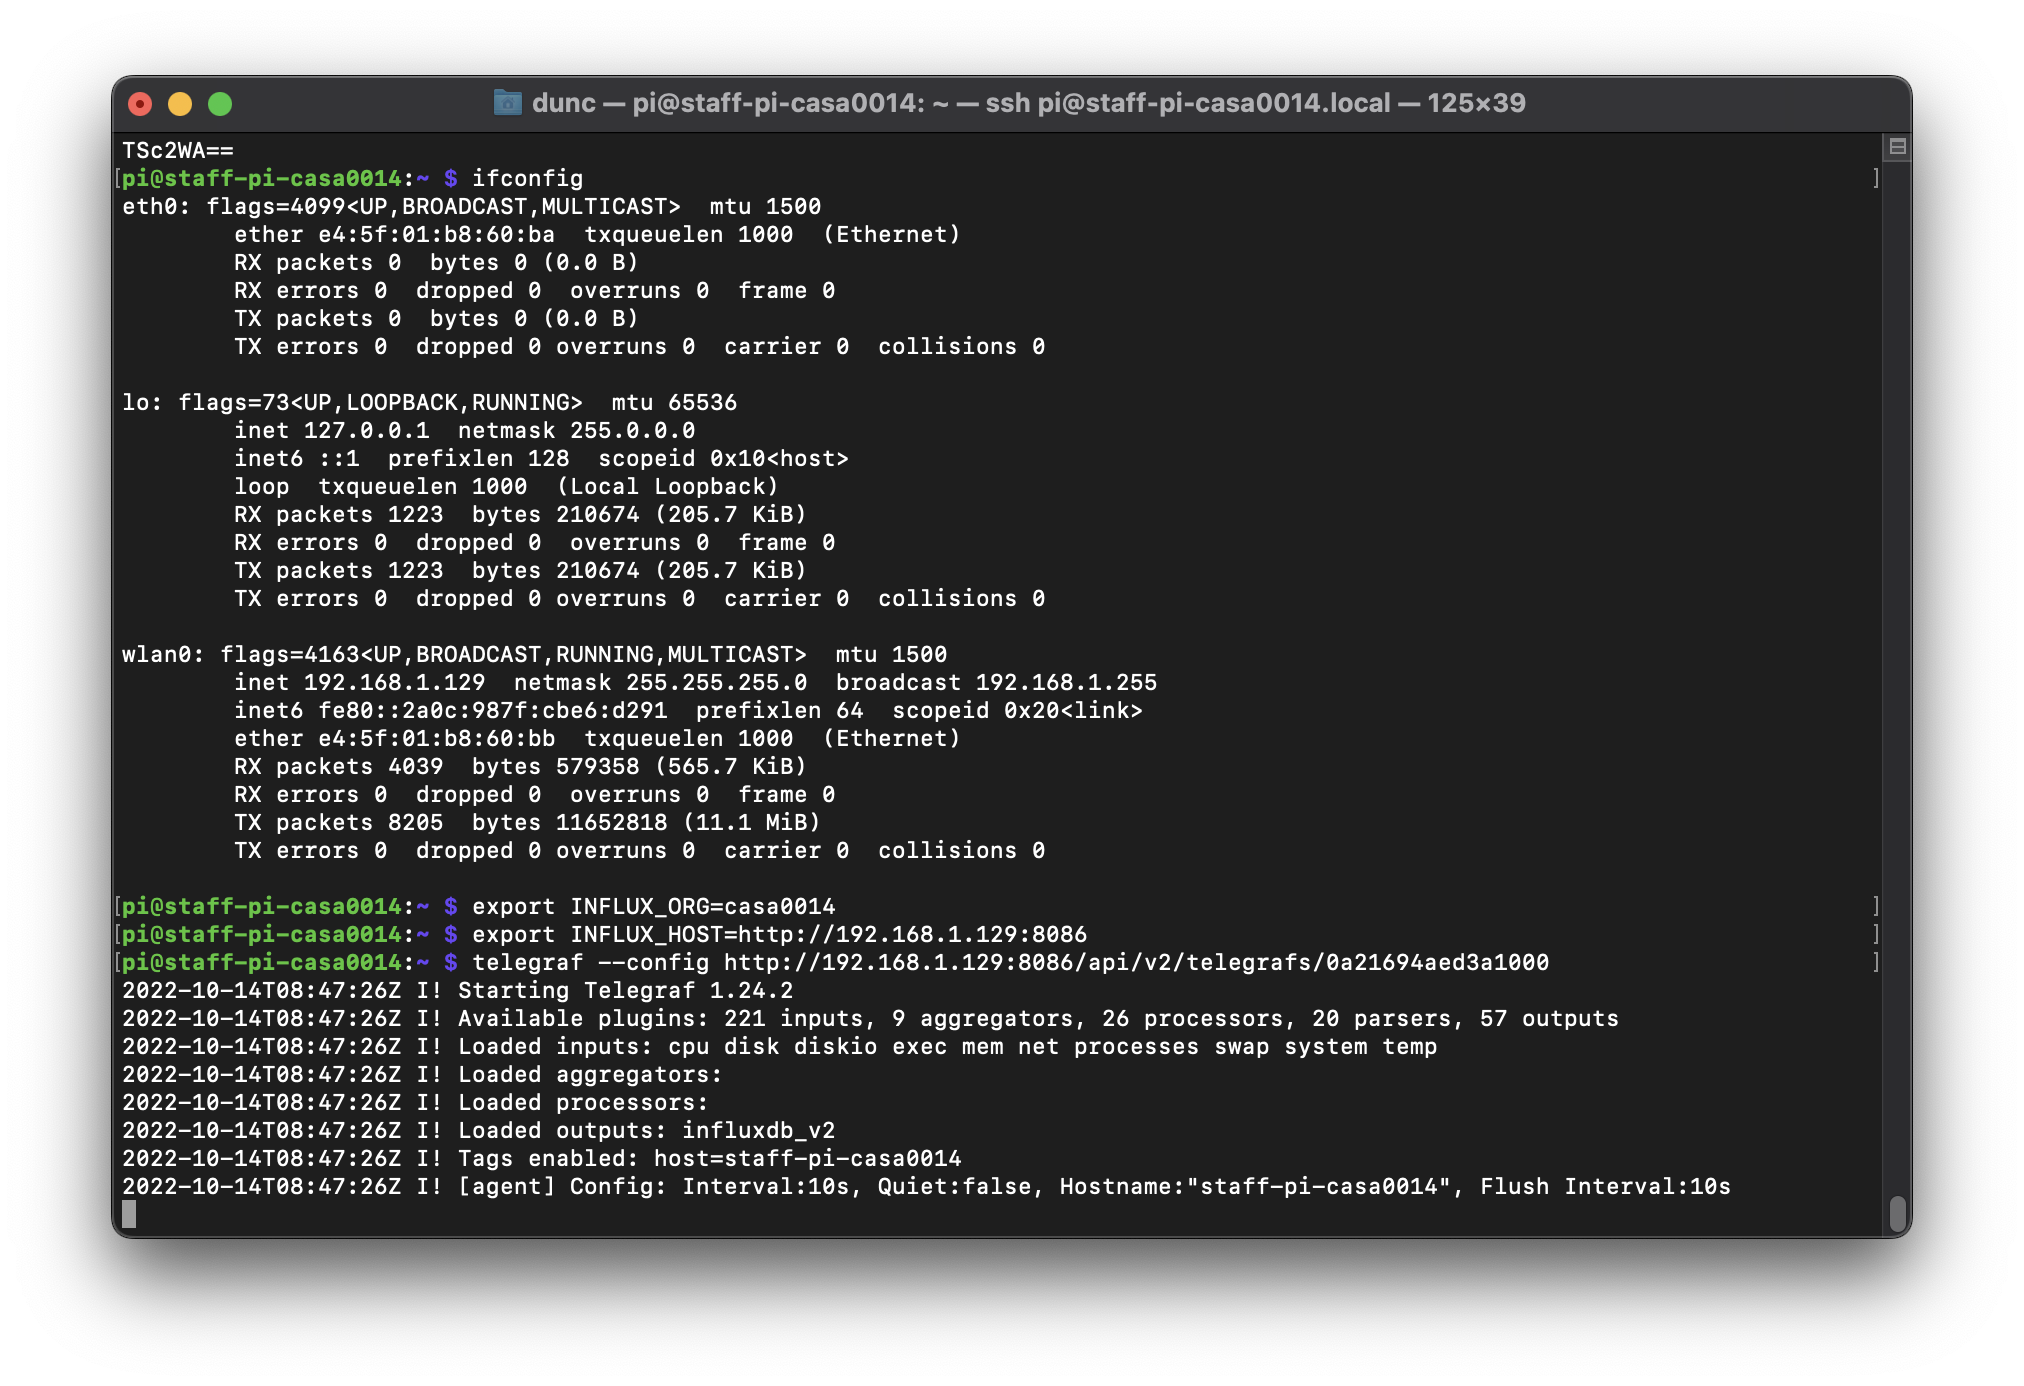
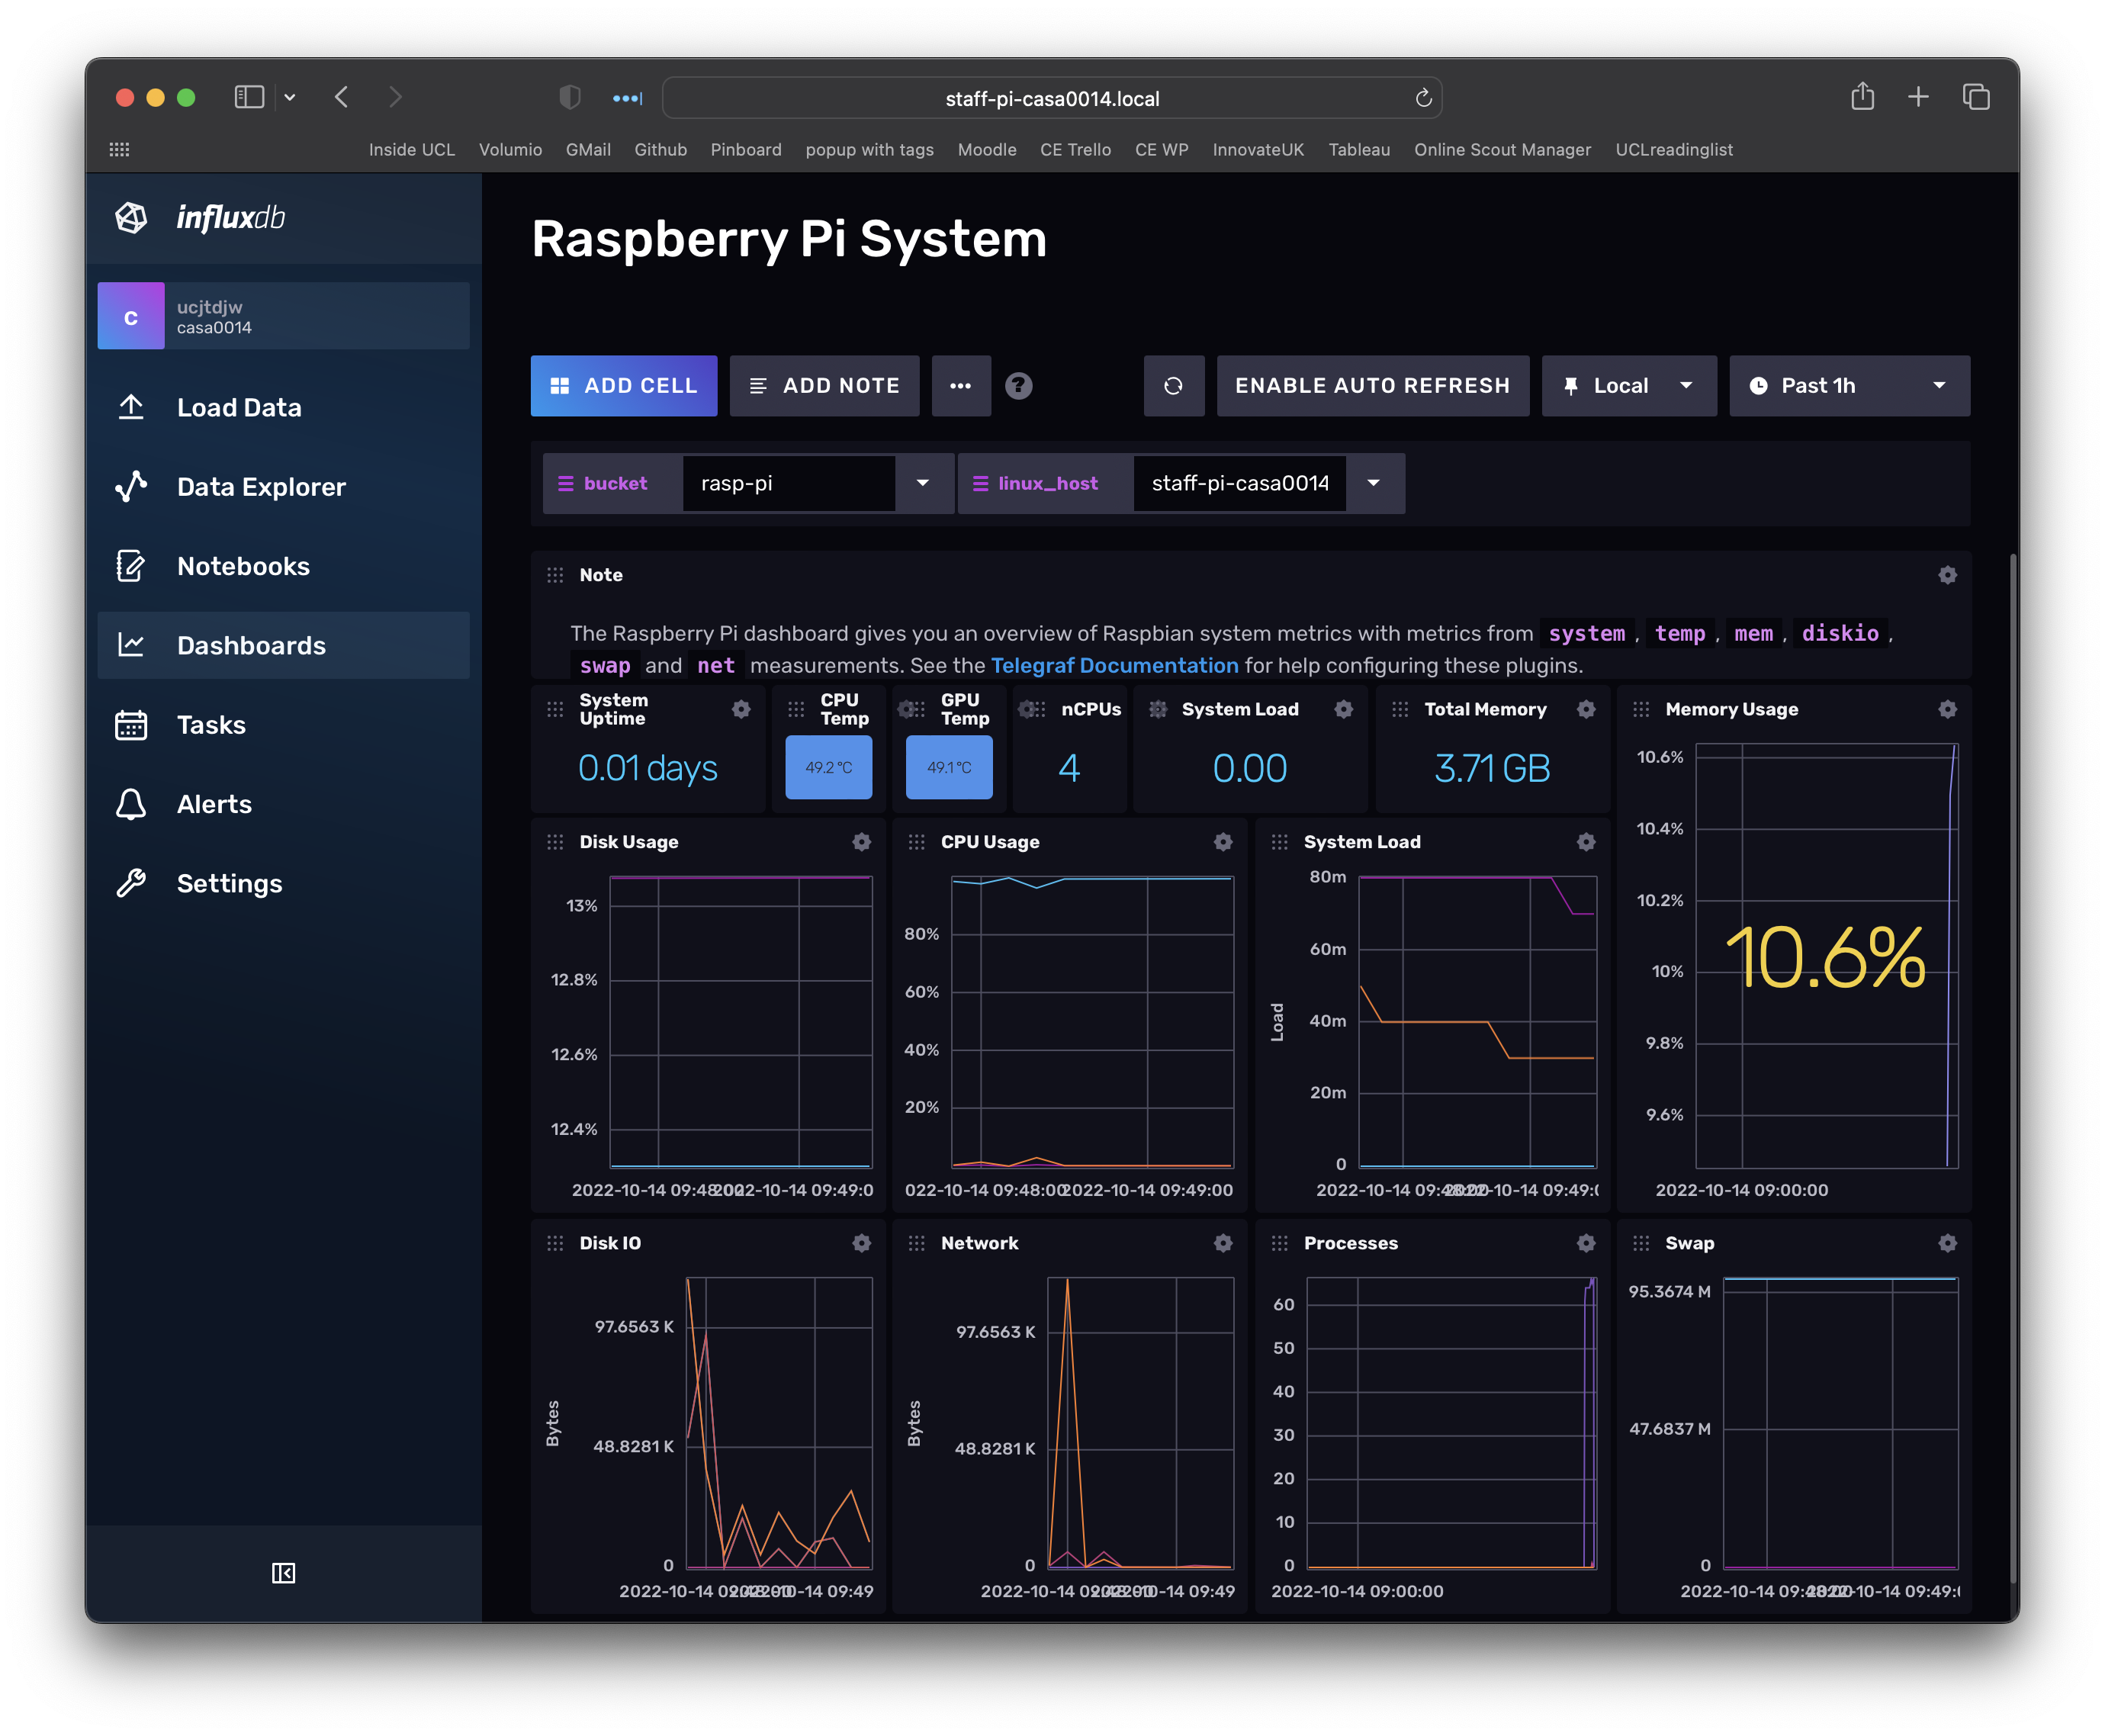
Back in InfluxDB you can go to the dashboards view and look at the template we downloaded for the RPi - this is taking data from the sensors on the RPi and inserting them into a Bucket called rasp-pi (make sure that is selected at the top of the dashboard if you are not seeing any data).
That telegraf agent is running live in the terminal using a config file that is stored in the web app (ie it is accessing it via the API).
Negative :
When you close the terminal session the telegraf script will stop running and therefore stop collecting data.
InfluxDB also has default configuration files stored in the local file system that get executed whenever InfluxDB is started. In the next step we will set-up another data collector to collect data from a seperate MQTT feed (ie not the Raspberry Pi monitor we have just been looking at).
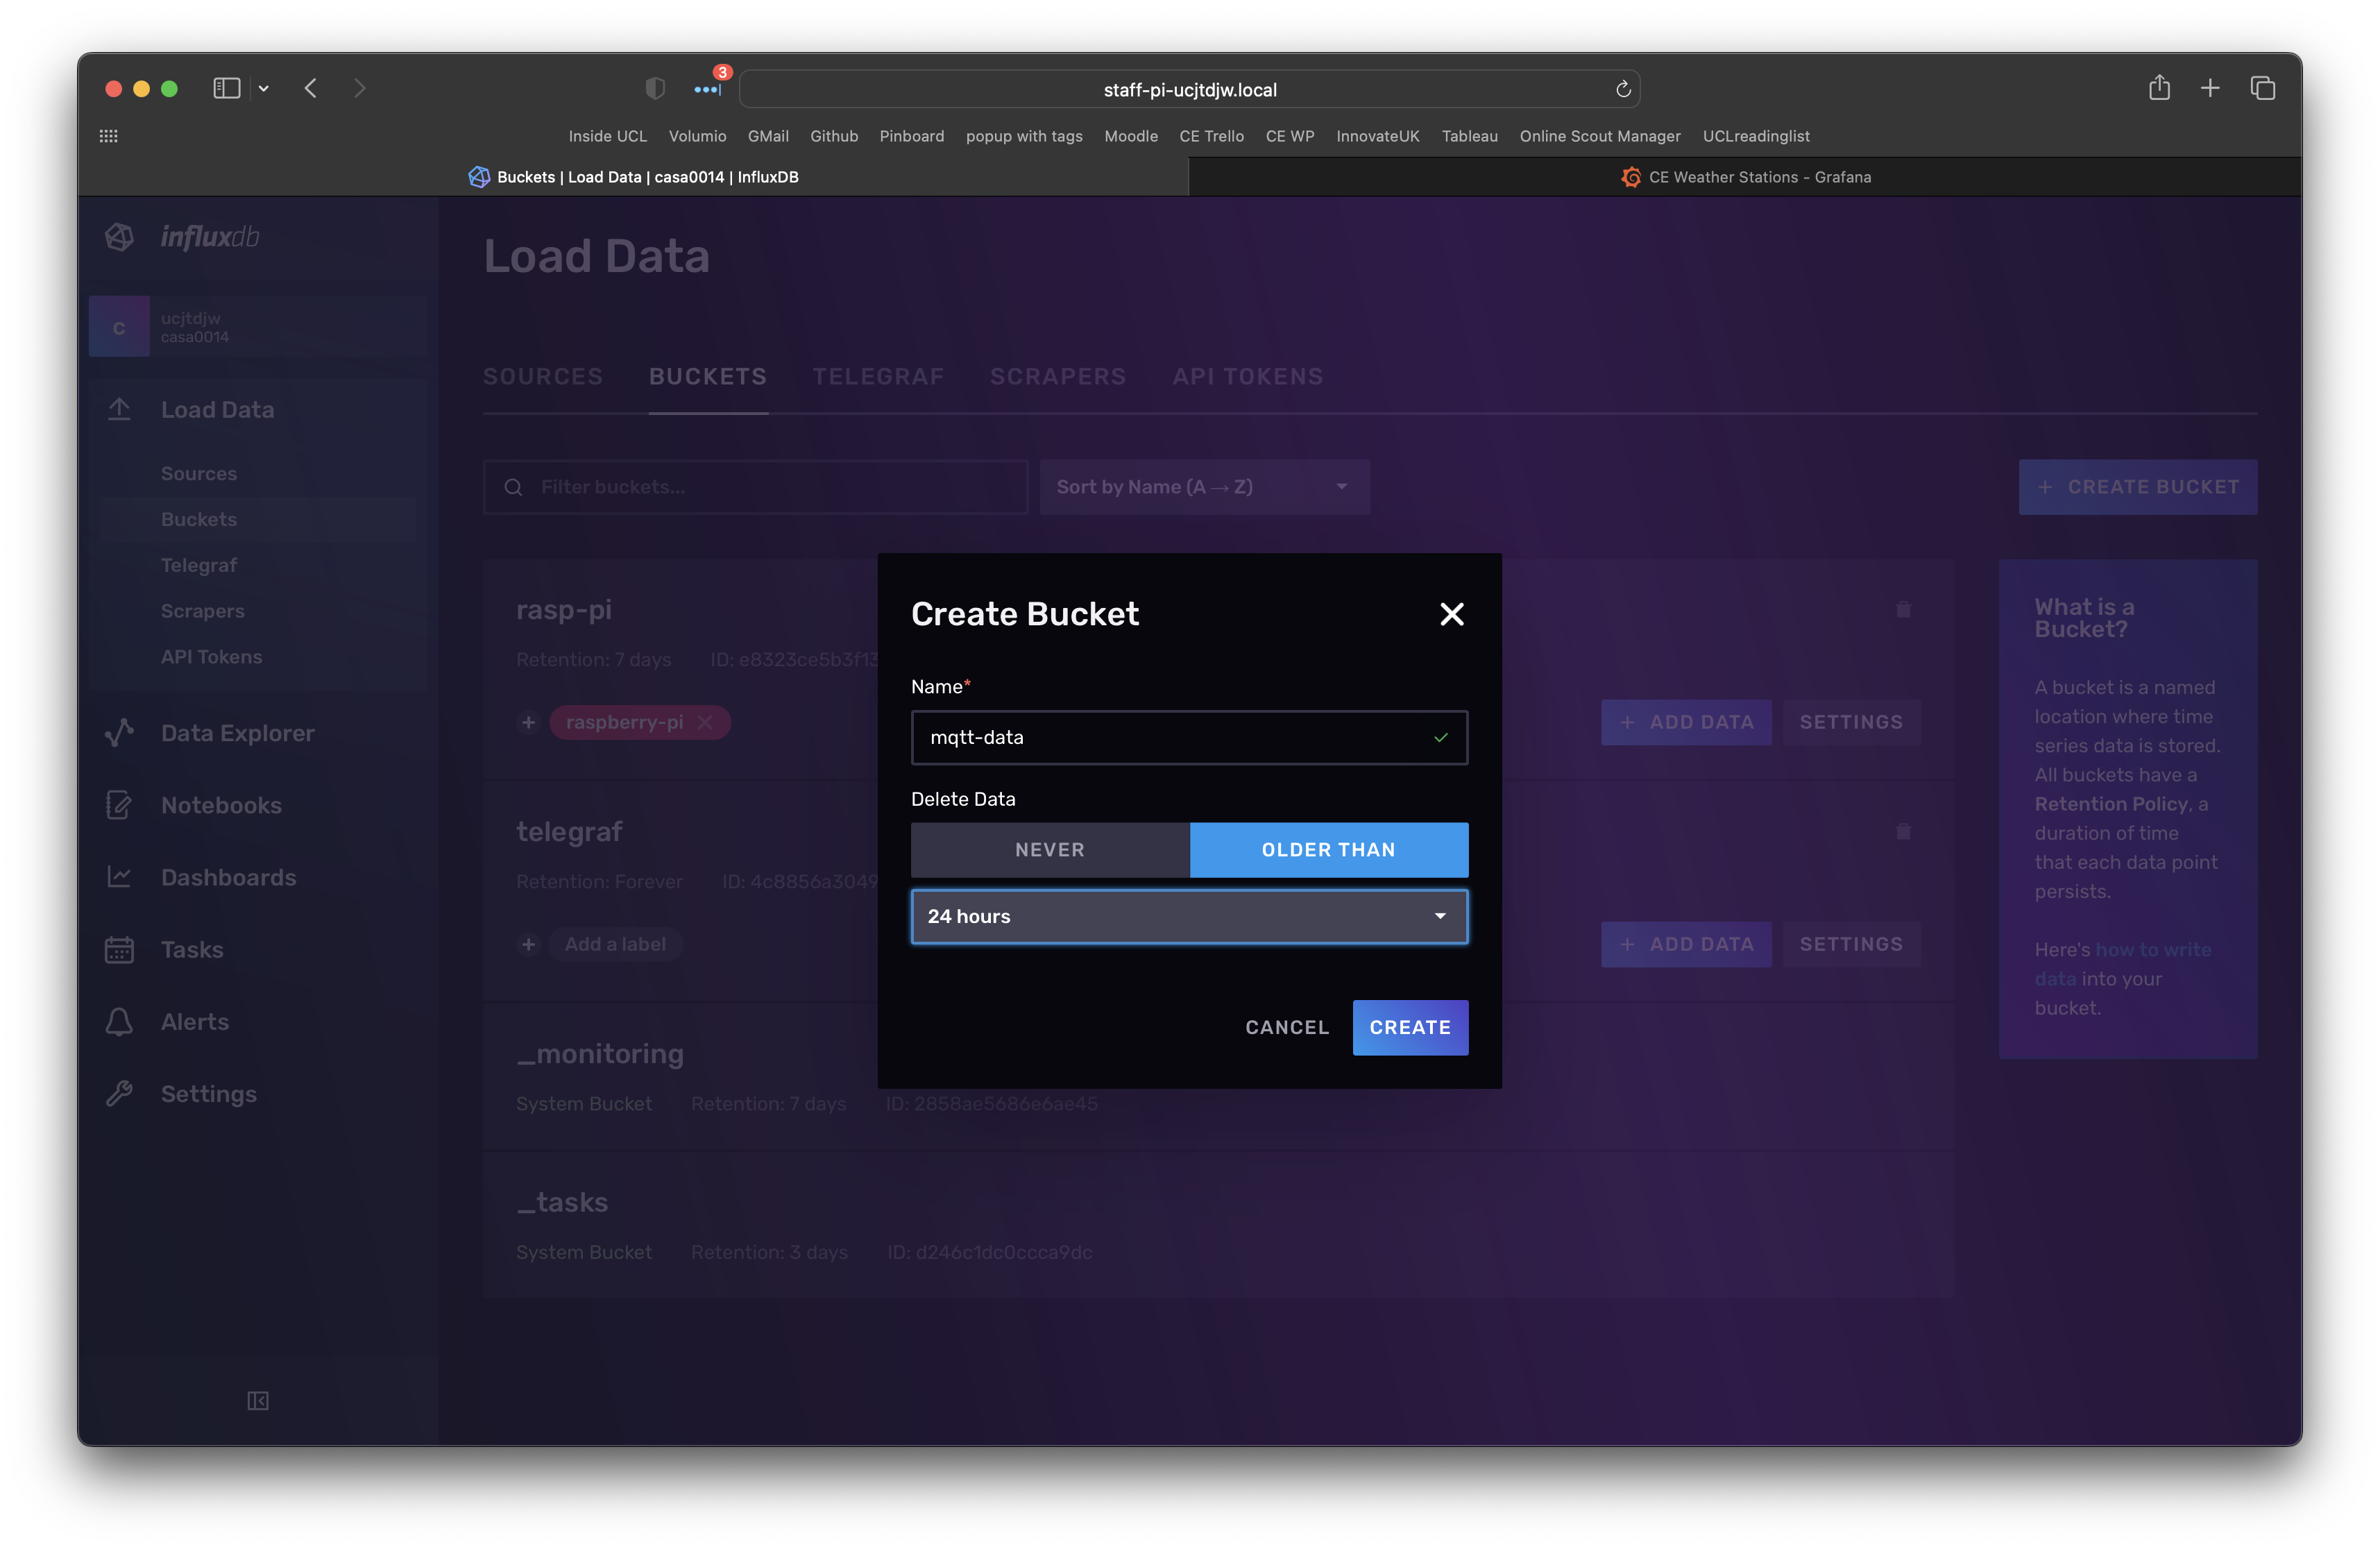
Set-up another bucket called mqtt-data to hold our data from the mqtt feed of a sensor (we will use our Chrono Lumina MQTT feed). Expand the left navigation (button at bottom left of window) and then select Buckets (under the Load Data menu) and select Create Bucket (button at top right). You should see a dialogue similar to below. Create a bucket called mqtt-data.
Now that we have a place to put data, our next step is to create the configuration file in Telegraf to subscribe to some MQTT data and send it to that bucket. A sample telegraf.conf is located at this Gist on GitHub.
Open up that configuration file in your favourite editor (e.g. Visual Studio Code). There are several variables that you will need to update. The red arrows below highlight them. The configuration is split into three sections:
- Global Settings - these are all minimal default values
- Output Plugins - define where the data should be sent and the authorisations to do that
- Input Plugins - these define the MQTT sources we are wanting to gather data from
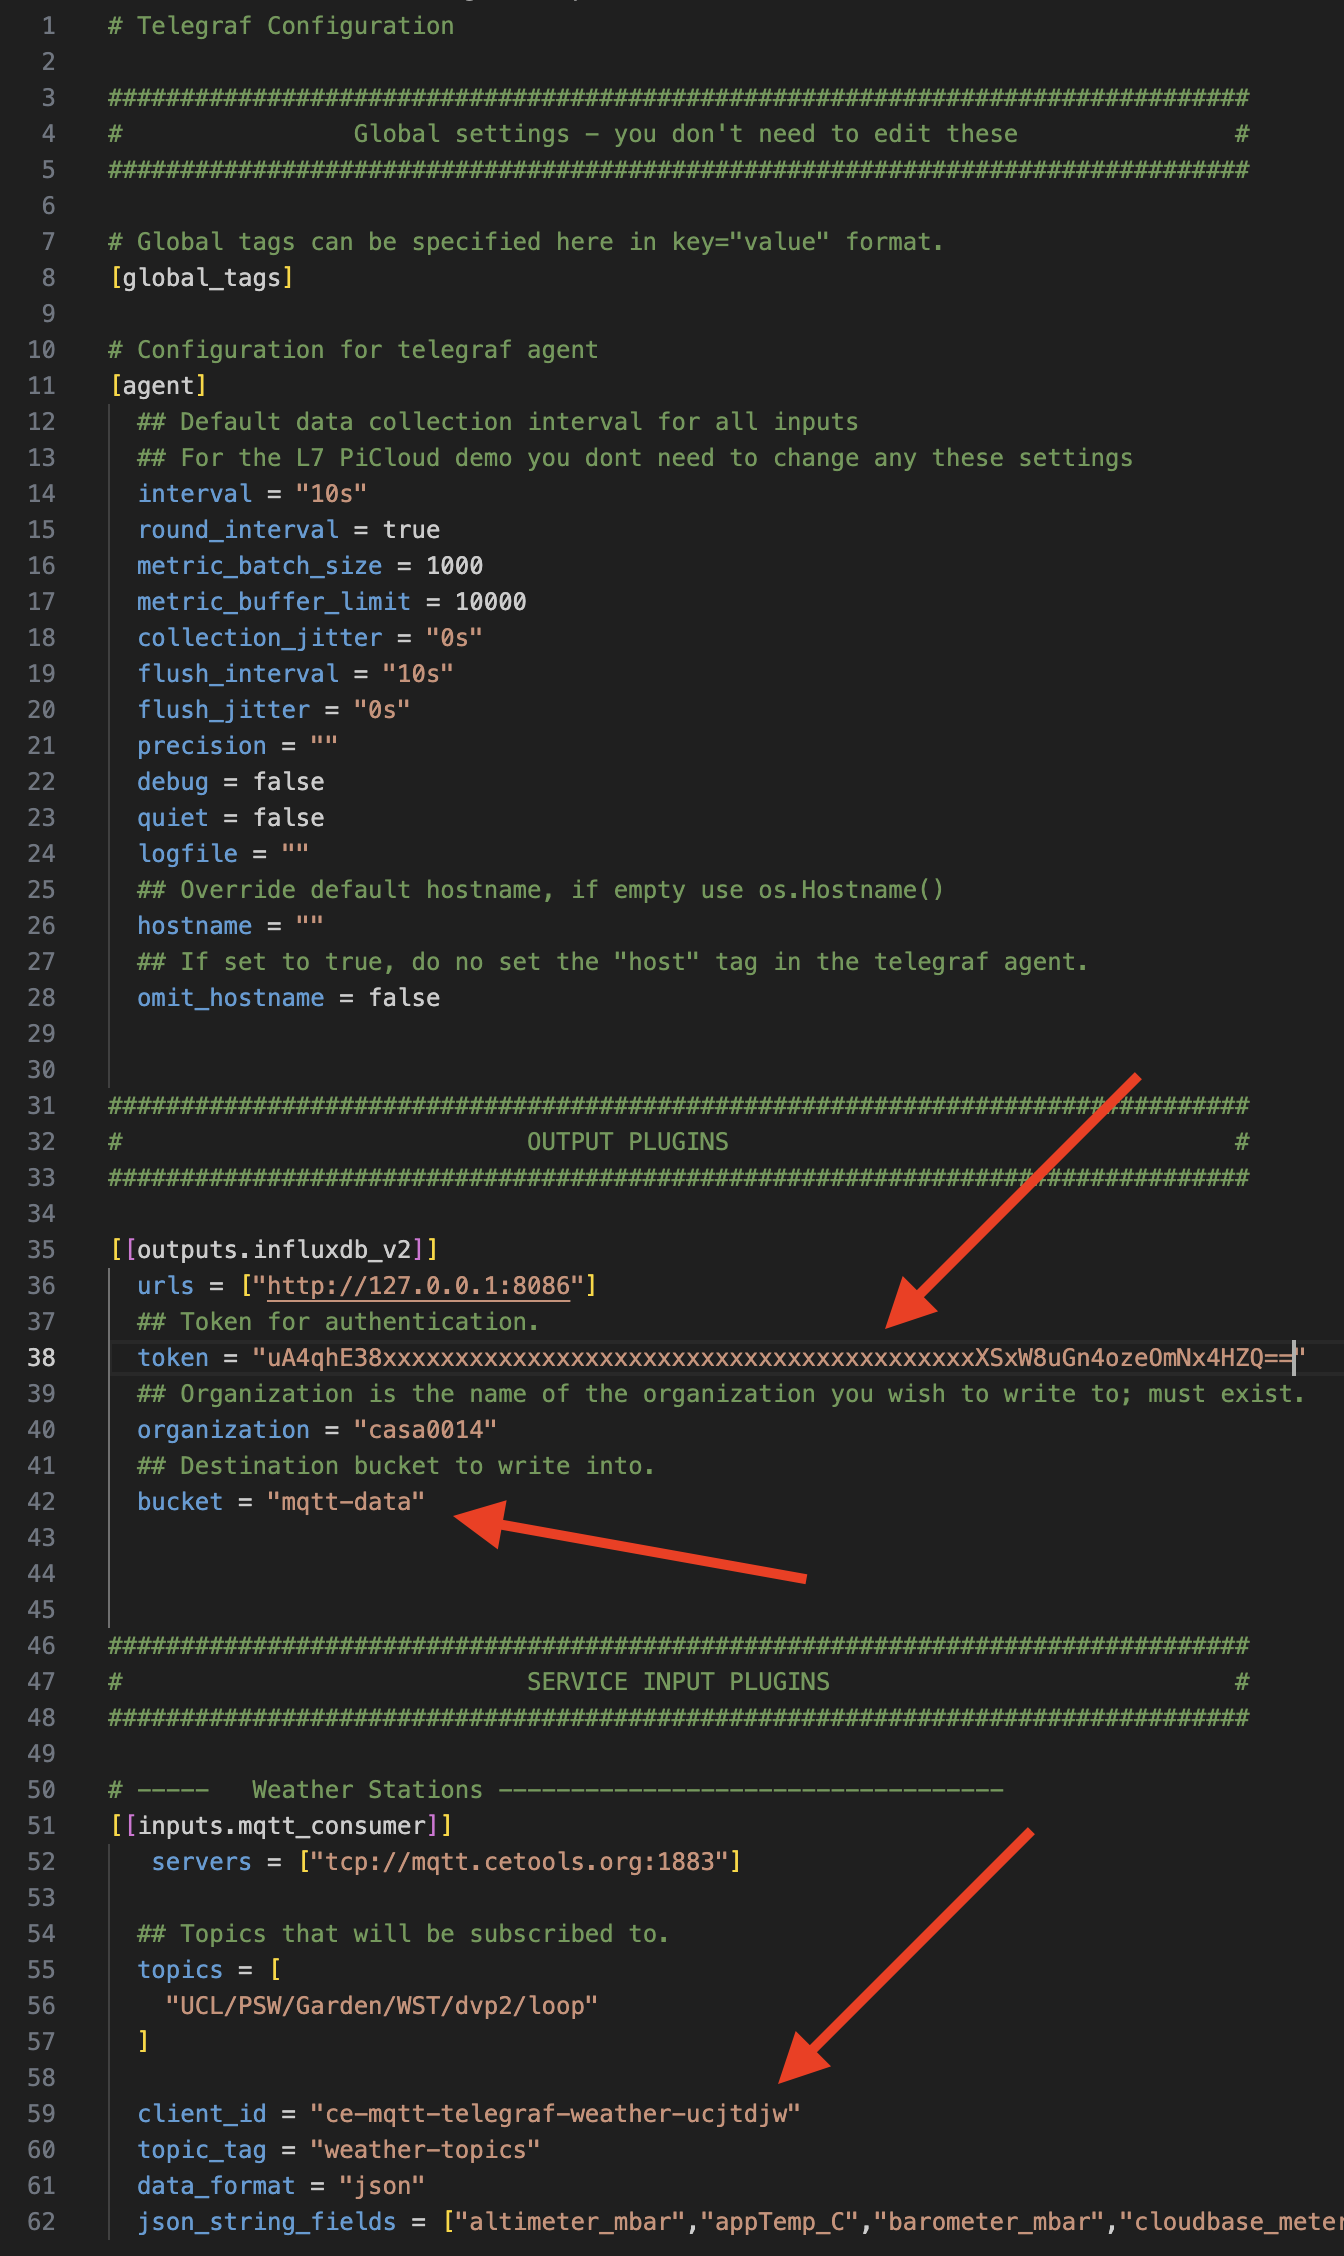
The first red arrow is in the OUTPUT PLUGIN and is the authorisation token to push data into the mqtt-data bucket. You already have a superuser token (mine is the ucjtdjw) and so we can use that for the mqtt-data bucket. However you could also use the Load Data > API Tokens section to create a new token for this authorisation.
Copy your user token into the token field.
Check the bucket field is named correctly (should be mqtt-data if you are following this tutorial precisely)
The third red arrow indicates that you need to edit the client_id so that it is unique to you (remember, we are subscribing to this topic on the MQTT broker which needs to know that we are different from the person sitting next to you, otherwise how will it know who to send the information to?)
Save the file and then we will copy it across to the RPi. One way to do this is to use Nano to edit the file. First we will take a copy of the original file for reference and then will create a new simplified one. Head back over to the Terminal session you have on your RPi and enter the following commands:
sudo mv /etc/telegraf/telegraf.conf /etc/telegraf/telegraf-original.conf
sudo nano /etc/telegraf/telegraf.conf
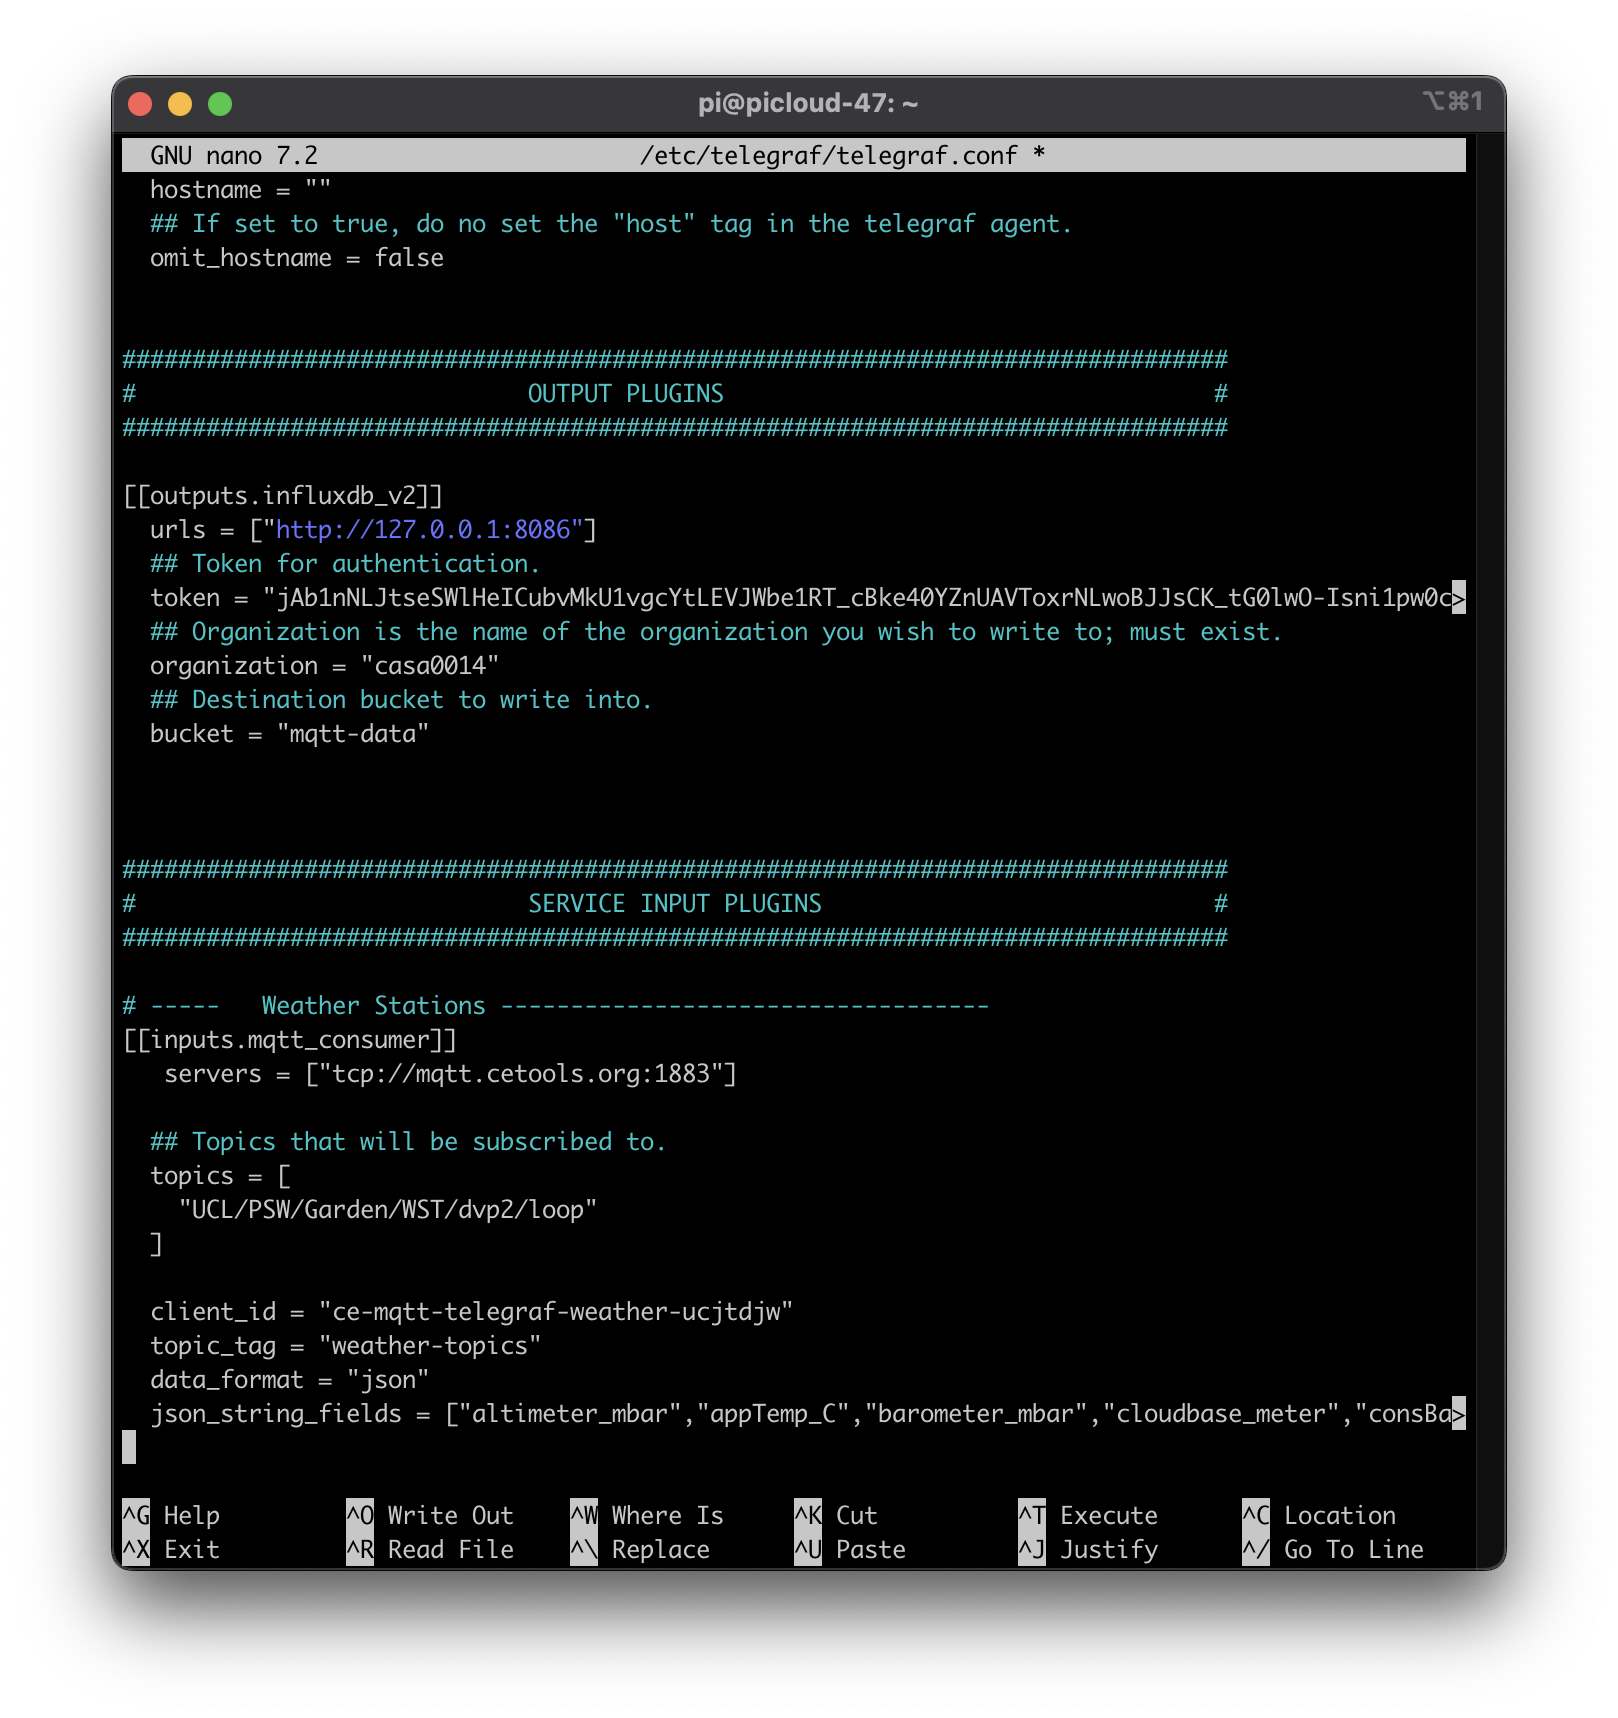
You shoud now see an empty nano file - copy paste your config file contents into this file and hit CTRL X to exit and save (don't change the file name). My Nano looked like image below after pasting in the content.
Restart the influxdb service for the configurations to be set and check the status:
sudo systemctl stop influxdb
sudo systemctl start influxdb
sudo systemctl status influxdb
(Note: use ctrl c to escape out of the status message)
sudo systemctl start telegraf
sudo systemctl status telegraf
Positive :
This is where learning to use the keyboard more in Terminal really helps - use the up and down arrows to navigate through the command line history.
You should now be able to explore the data through the Data Explorer - select the View Raw Data switch.
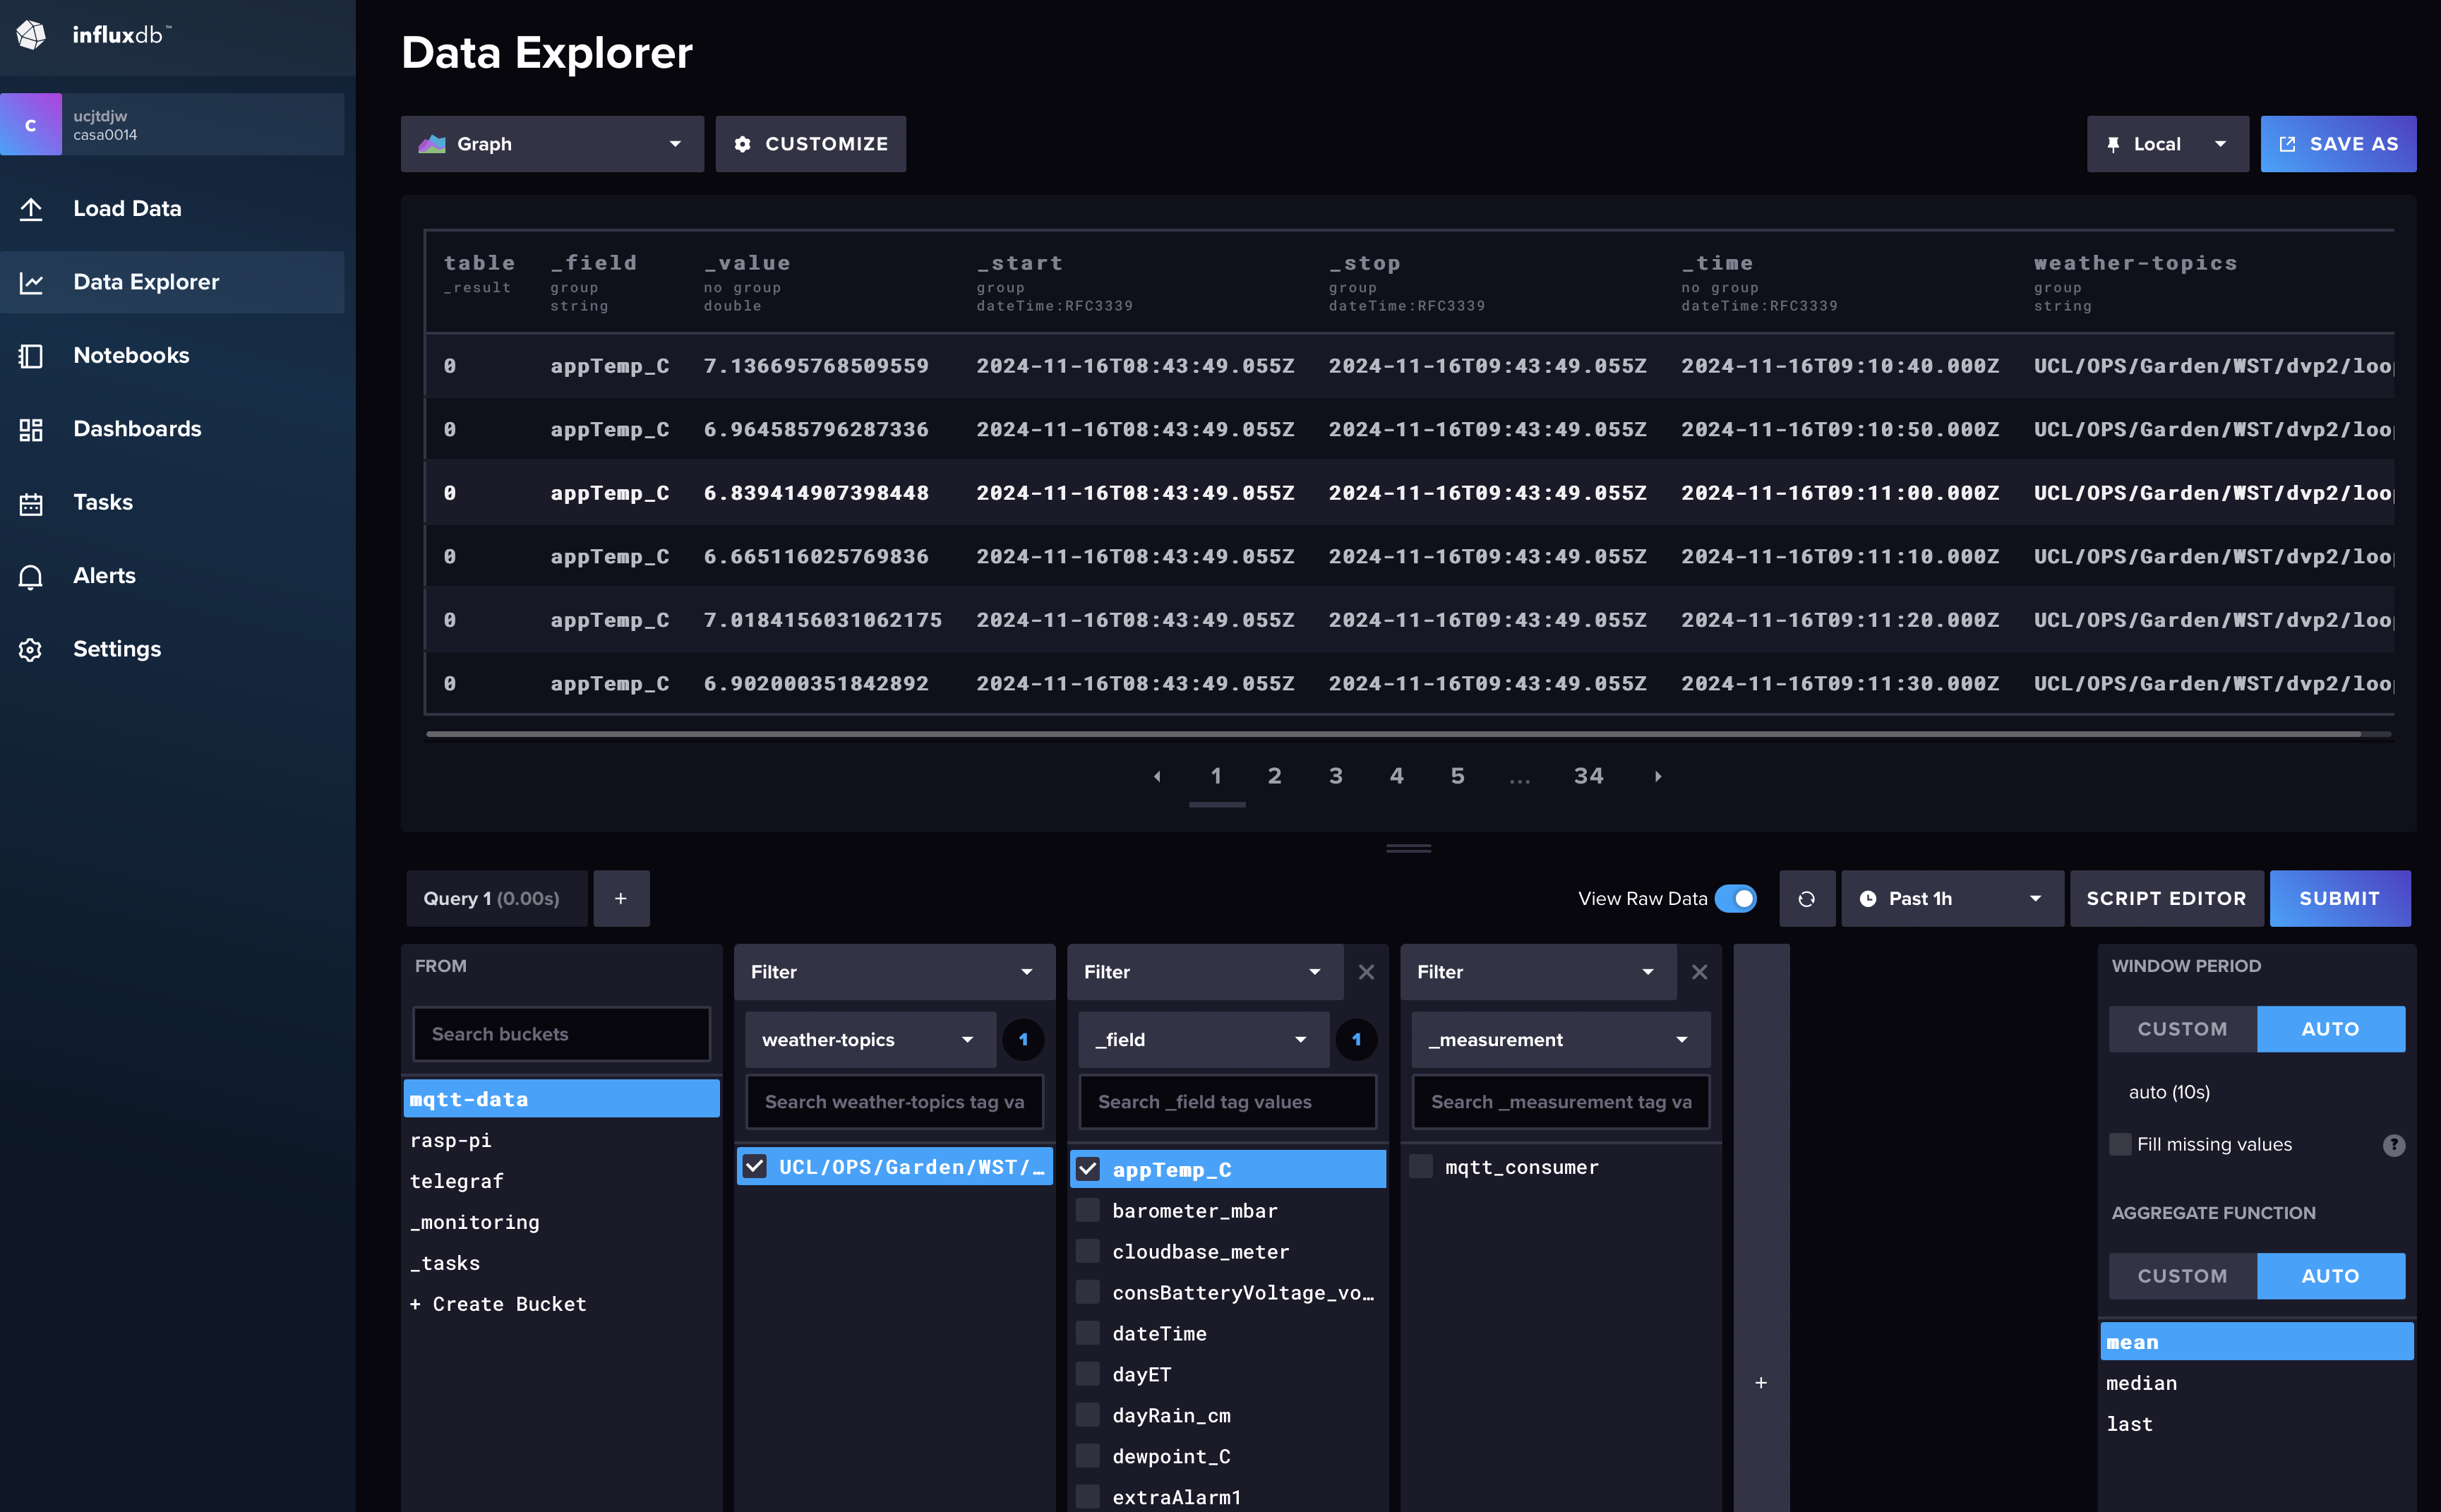
To view the data as a chart in the Data Explorer you will need to use the code snippet below in the Script Editor view of the explorer (and switch off View Raw Data !)
from(bucket: "mqtt-data")
  |> range(start: v.timeRangeStart, stop: v.timeRangeStop)
  |> filter(fn: (r) => r["weather-topics"] == "UCL/OPS/Garden/WST/dvp2/loop")
  |> filter(fn: (r) => r["_field"] == "appTemp_C")
  |> map(fn:(r) => ({ r with
      _value: float(v: r["_value"])
    }))
  |> aggregateWindow(every: v.windowPeriod, fn: mean, createEmpty: false)
The key addition to the code above is the map function (which InfluxDB does not add by default) - our weather data is read by the telegraf script as text and so the Data Explorer is not interpreting the data correctly - we have to convert it into a float value for it to be graphed.
We could have added a bit more complexity to the telegraf.conf to explicitly convert specific fields to floats, but we wanted to keep it simple. Take a look at [[processors.converter]] to learn more.
[[inputs.mqtt_consumer]]
  # ... (existing configuration) ...

  # Filter to convert specific fields
  [[processors.converter]]
    tags = []
    fields = {
      "inTemp_C" = "toFloat",
      "outTemp_C" = "toFloat",
      # Add other fields you want as floats
    }
In the final step we will install Grafana so that we can visualise the data in the InfluxDB. Open the Grafana download page and follow the instructions to install the "Ubuntu and Debian (Arm64)" install:
sudo apt-get install -y adduser libfontconfig1 musl
wget https://dl.grafana.com/enterprise/release/grafana-enterprise_11.3.0+security~01_arm64.deb
sudo dpkg -i grafana-enterprise_11.3.0+security~01_arm64.deb
Once installed make sure to follow the in terminal instructions to add grafana to systemd and then to start the service:
sudo /bin/systemctl daemon-reload
sudo /bin/systemctl enable grafana-server
sudo /bin/systemctl start grafana-server
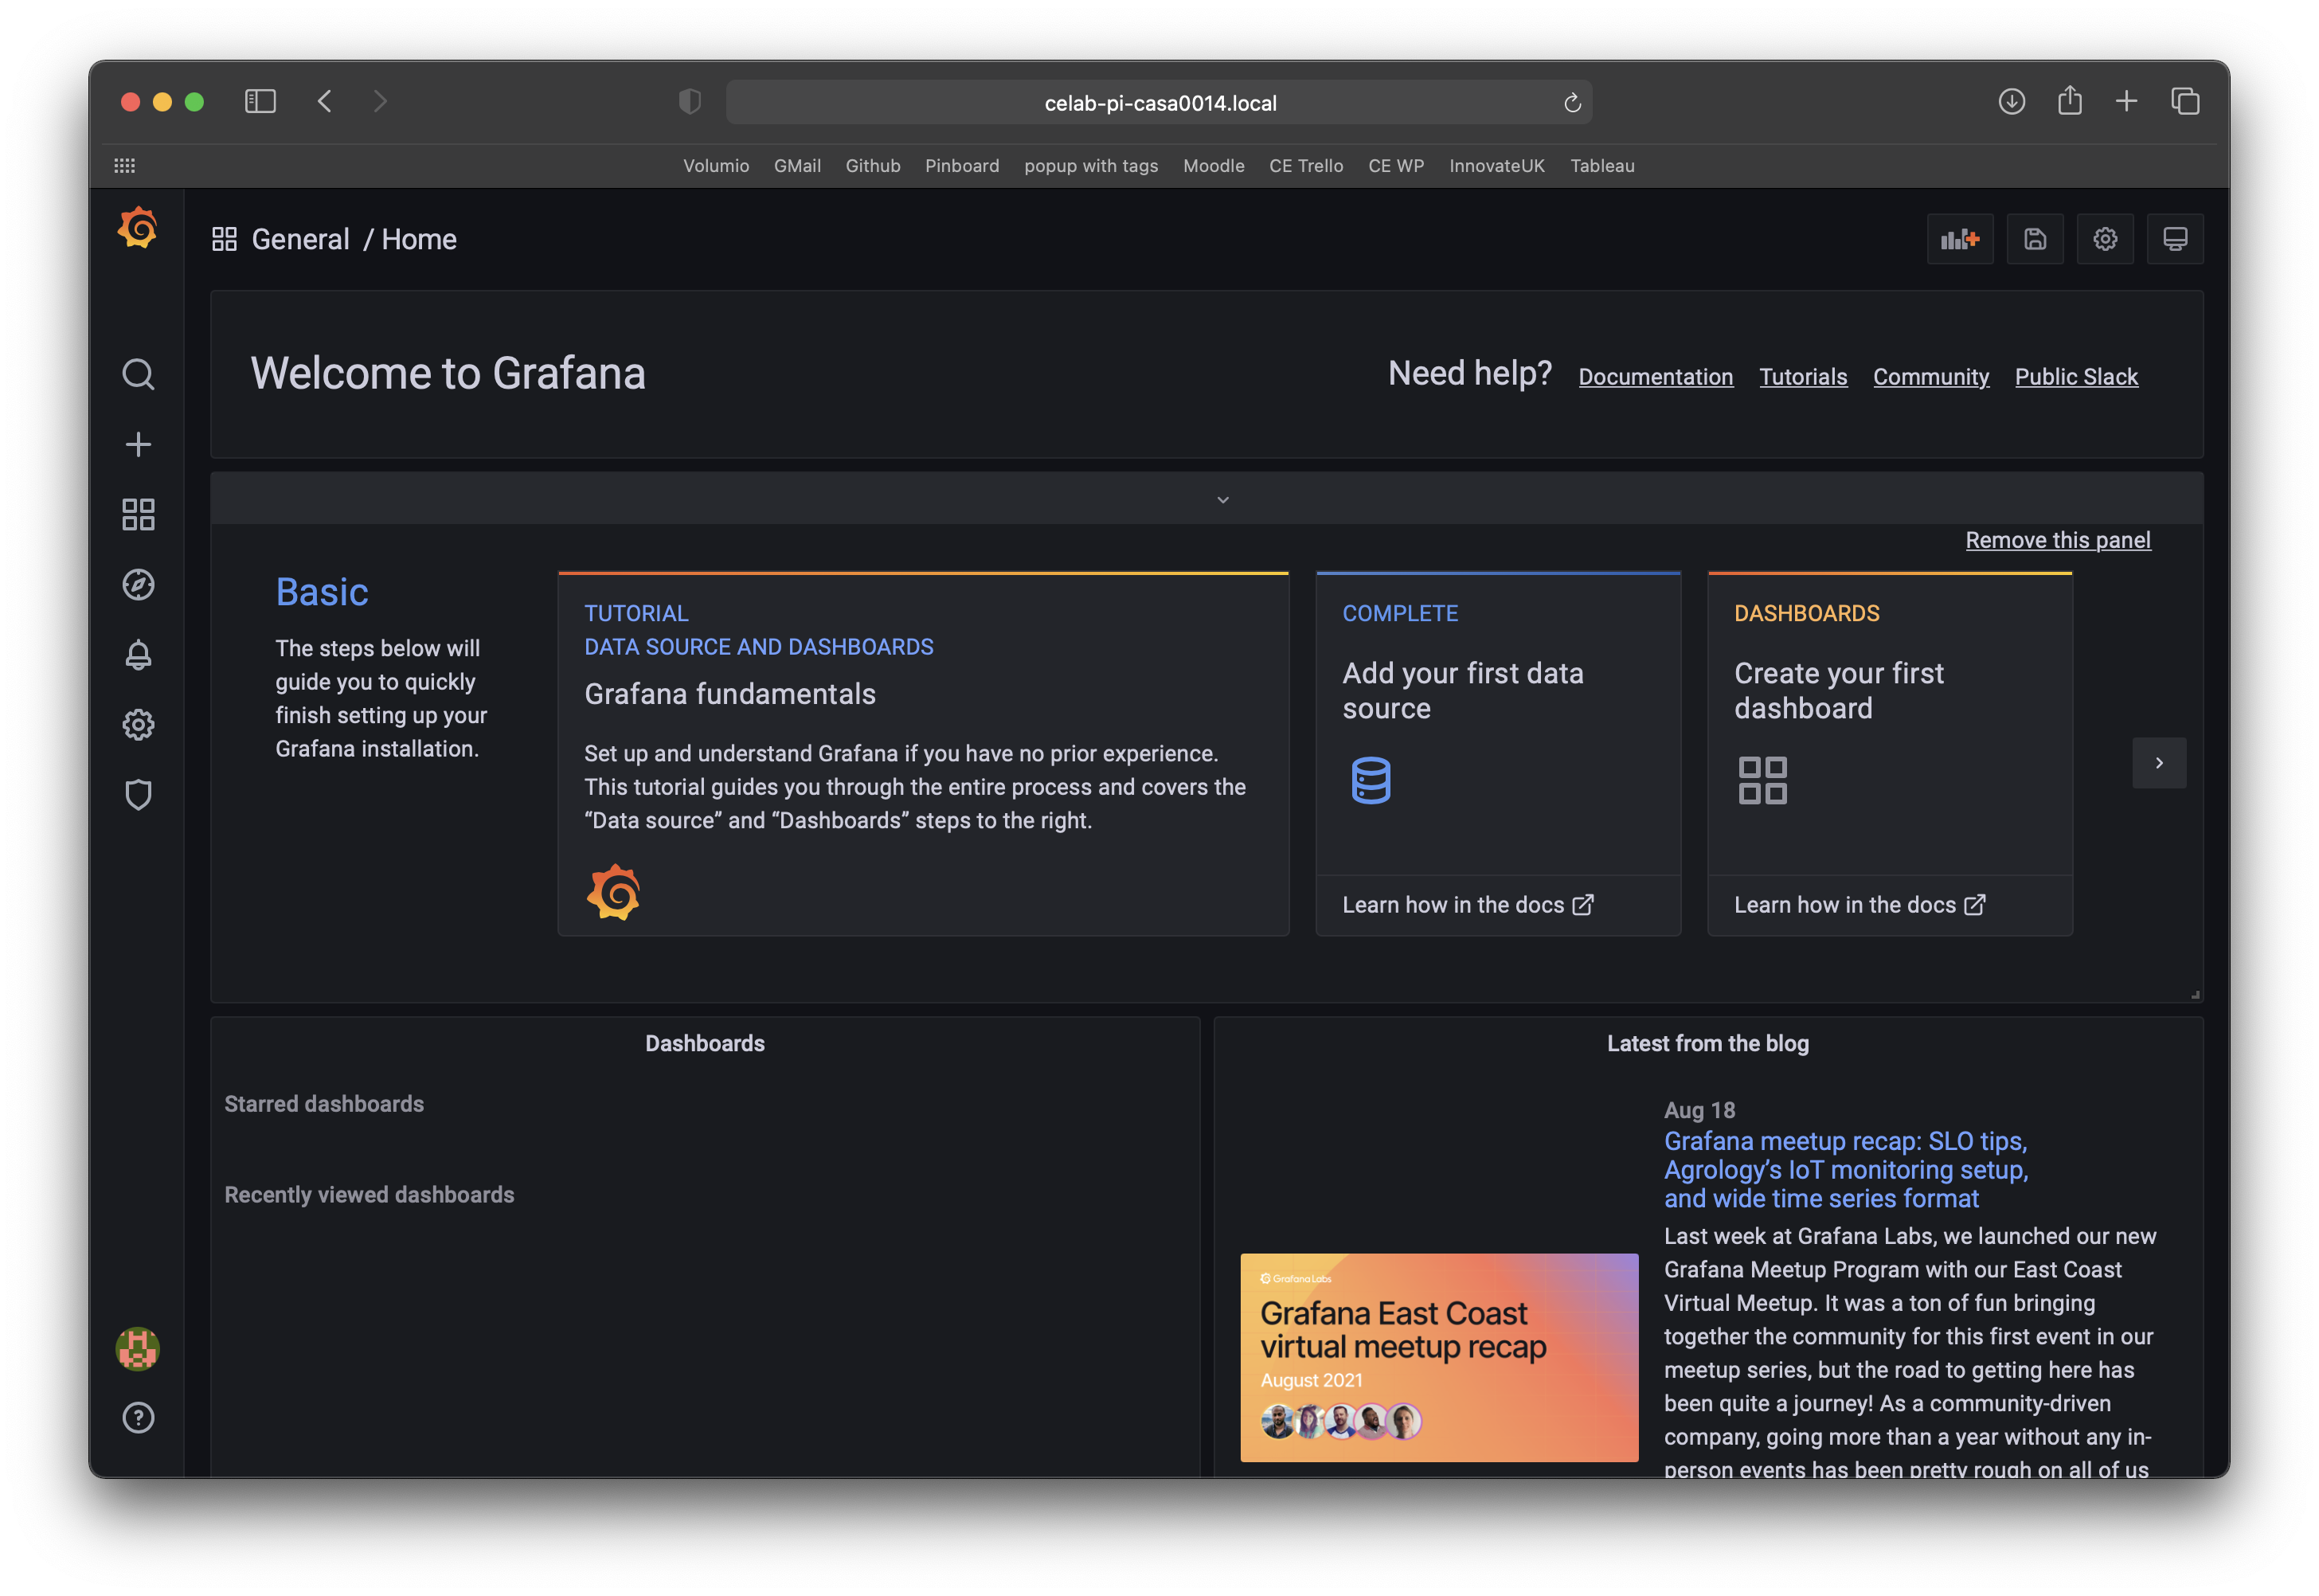
You should now be able to browse to http://localhost:3000 and see the Grafana welcome page - the default user pass is admin admin (change your password when requested and note it down somewhere).
Similar to the previous two tools Grafana also has a documentation page for the config file
For some useful resources and for the query syntax of the TS tables look at:
https://docs.influxdata.com/influxdb/v2.4/
In this final step we will set up a Grafana dashboard so that you can visualise your sensed data. Grafana was installed above so open a browser and go the address http://10.129.111.47:3000 (edit the IP address to your Raspberry Pi IP). You should see a welcome screen like:
In the middle of the dashboard you should see a prompt to Add your first datasource click on that and fill out the following details:
- select InfluxDB
- select Flux as the Query Language (needed for v2 of InfluxDB)
- add
http://127.0.0.1:8086at the URL - uncheck / deselect
basic auth - add org name and copy in your user API token from InfluxDB
- add
mqtt-dataas the default bucket
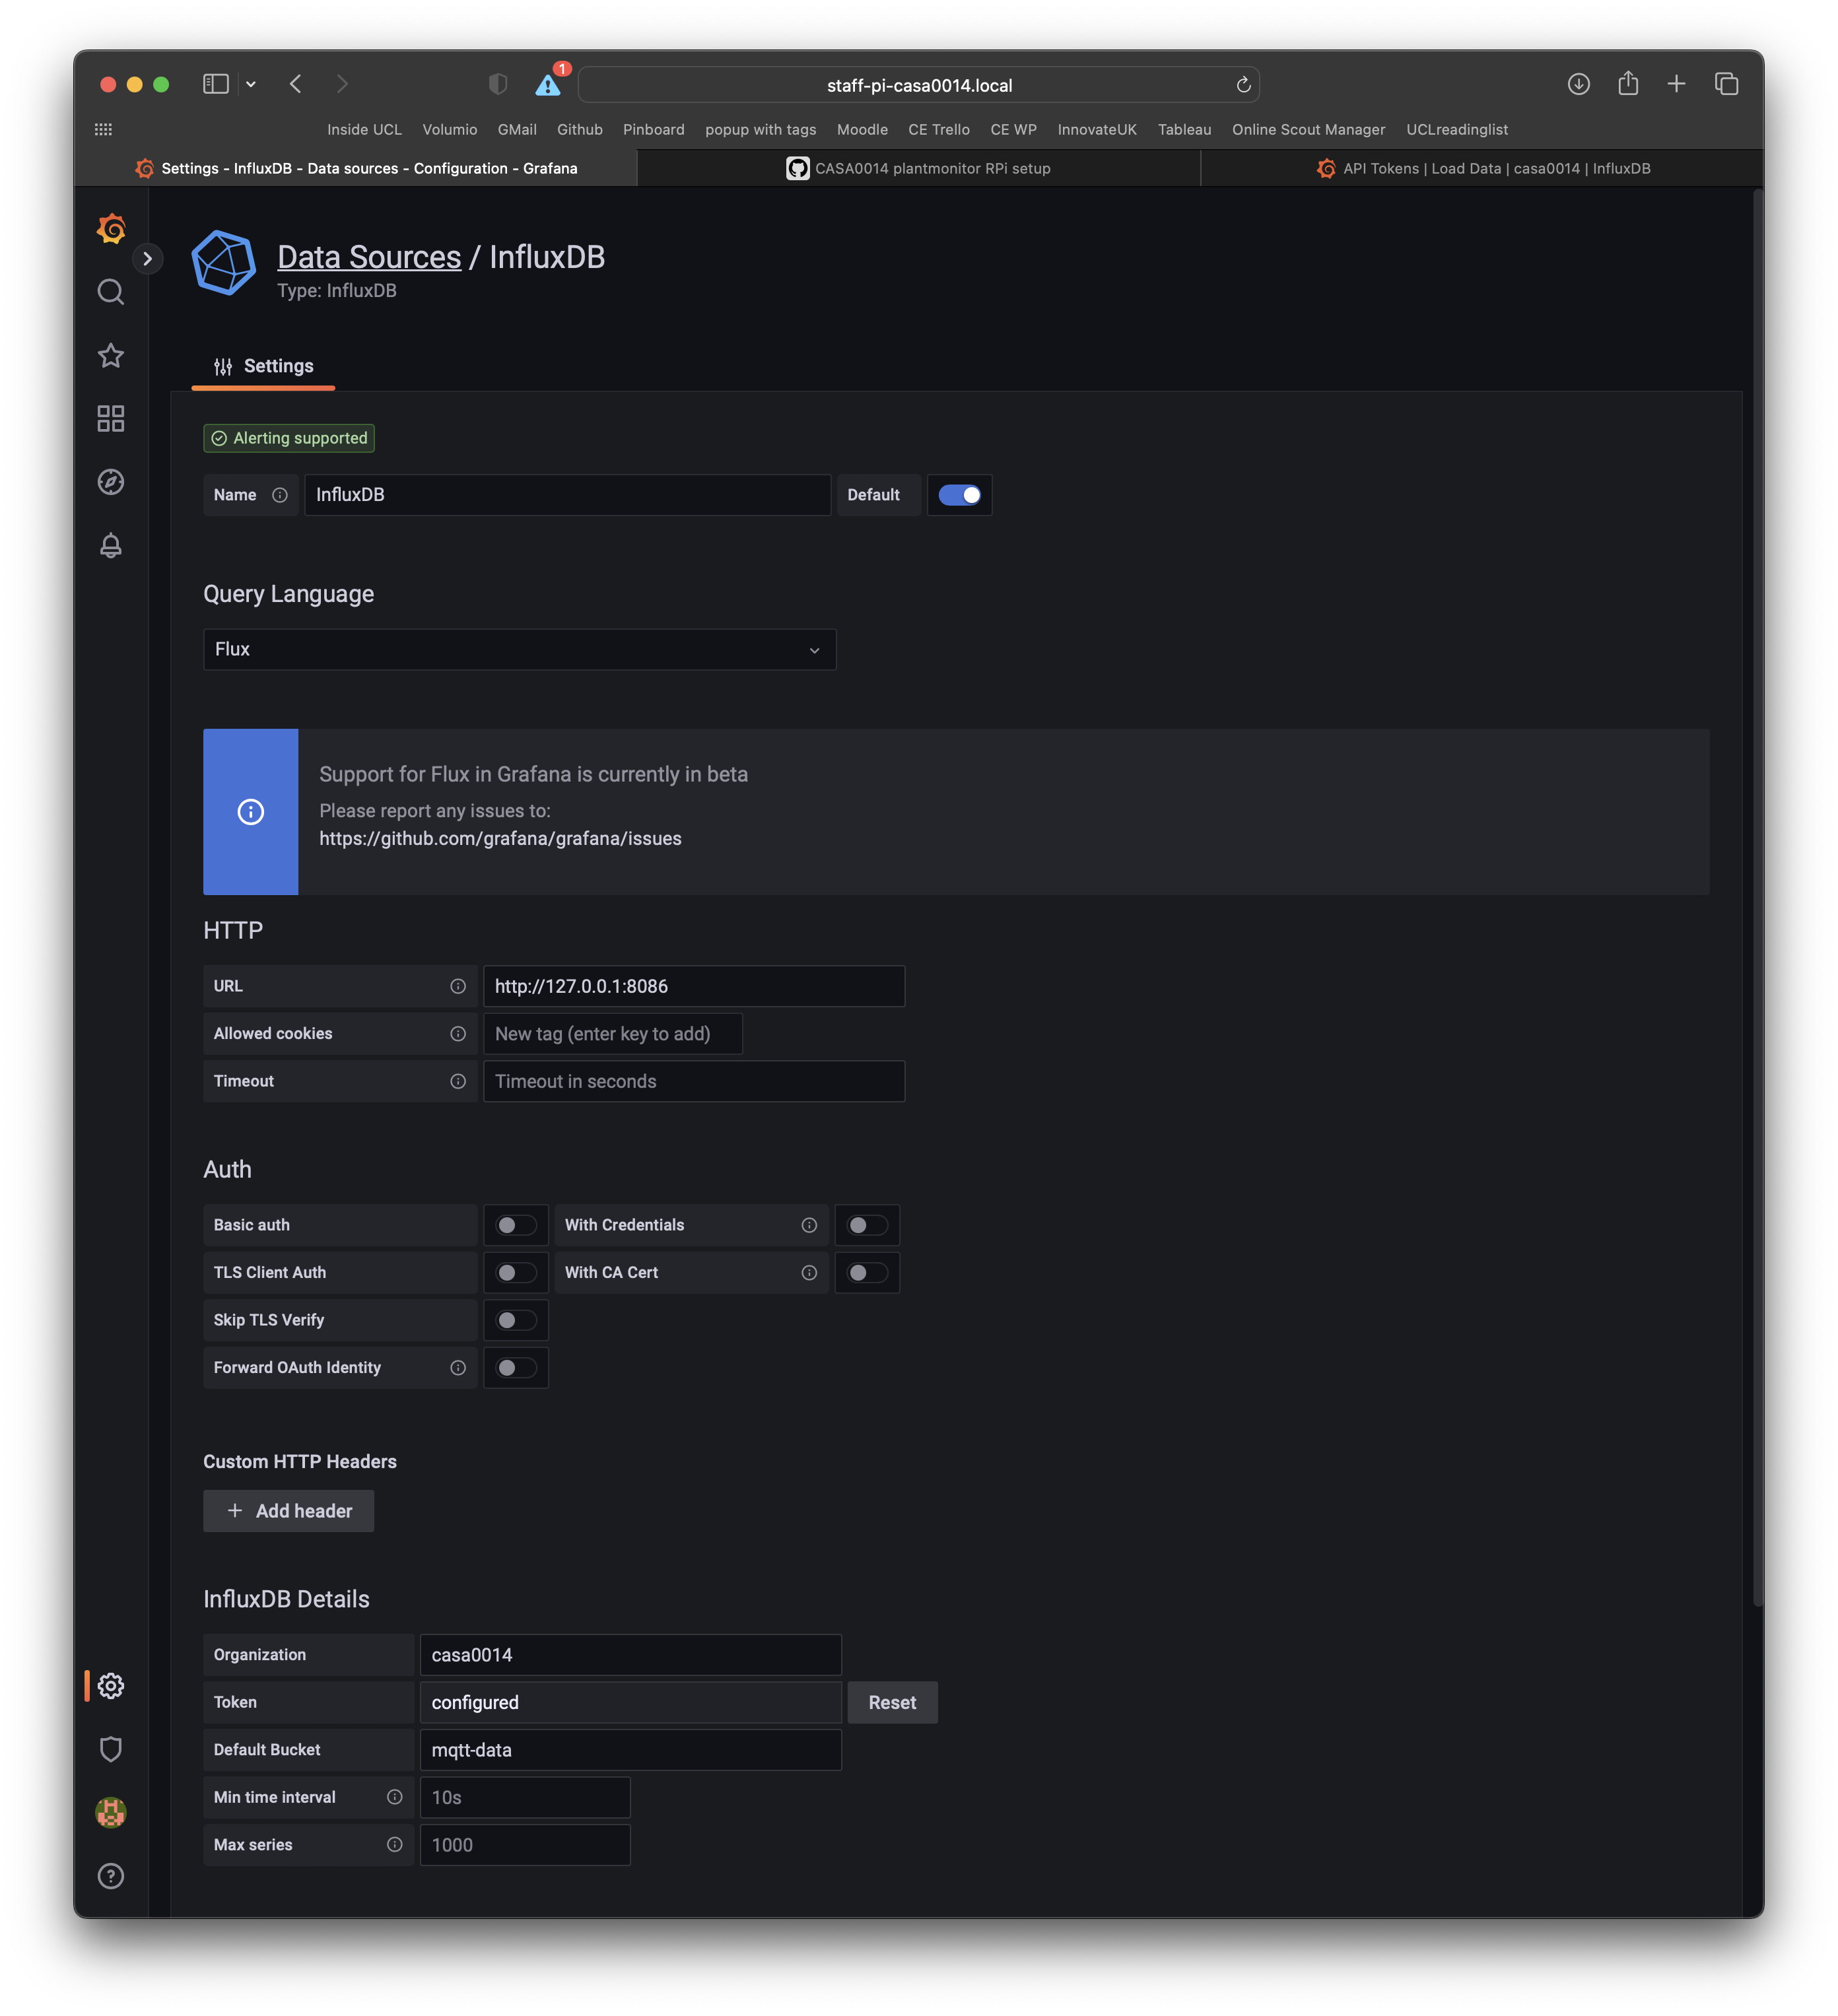
Select save and test at the bottom of the page to check the connection works.
You can always get back to this settings page by following the Configuration item in the left hand menu and selecting Datasources (Icon looks like a small cog).
To create a dashboard select Create Dashboard from the home page and then select Add Visualisation and use your InfluxDB as the datasource.
In the query panel you can enter queries just like those used in the Dashboard for InfluxDB. At the bottom of the panel you can also select Sample Query to explore query syntax.
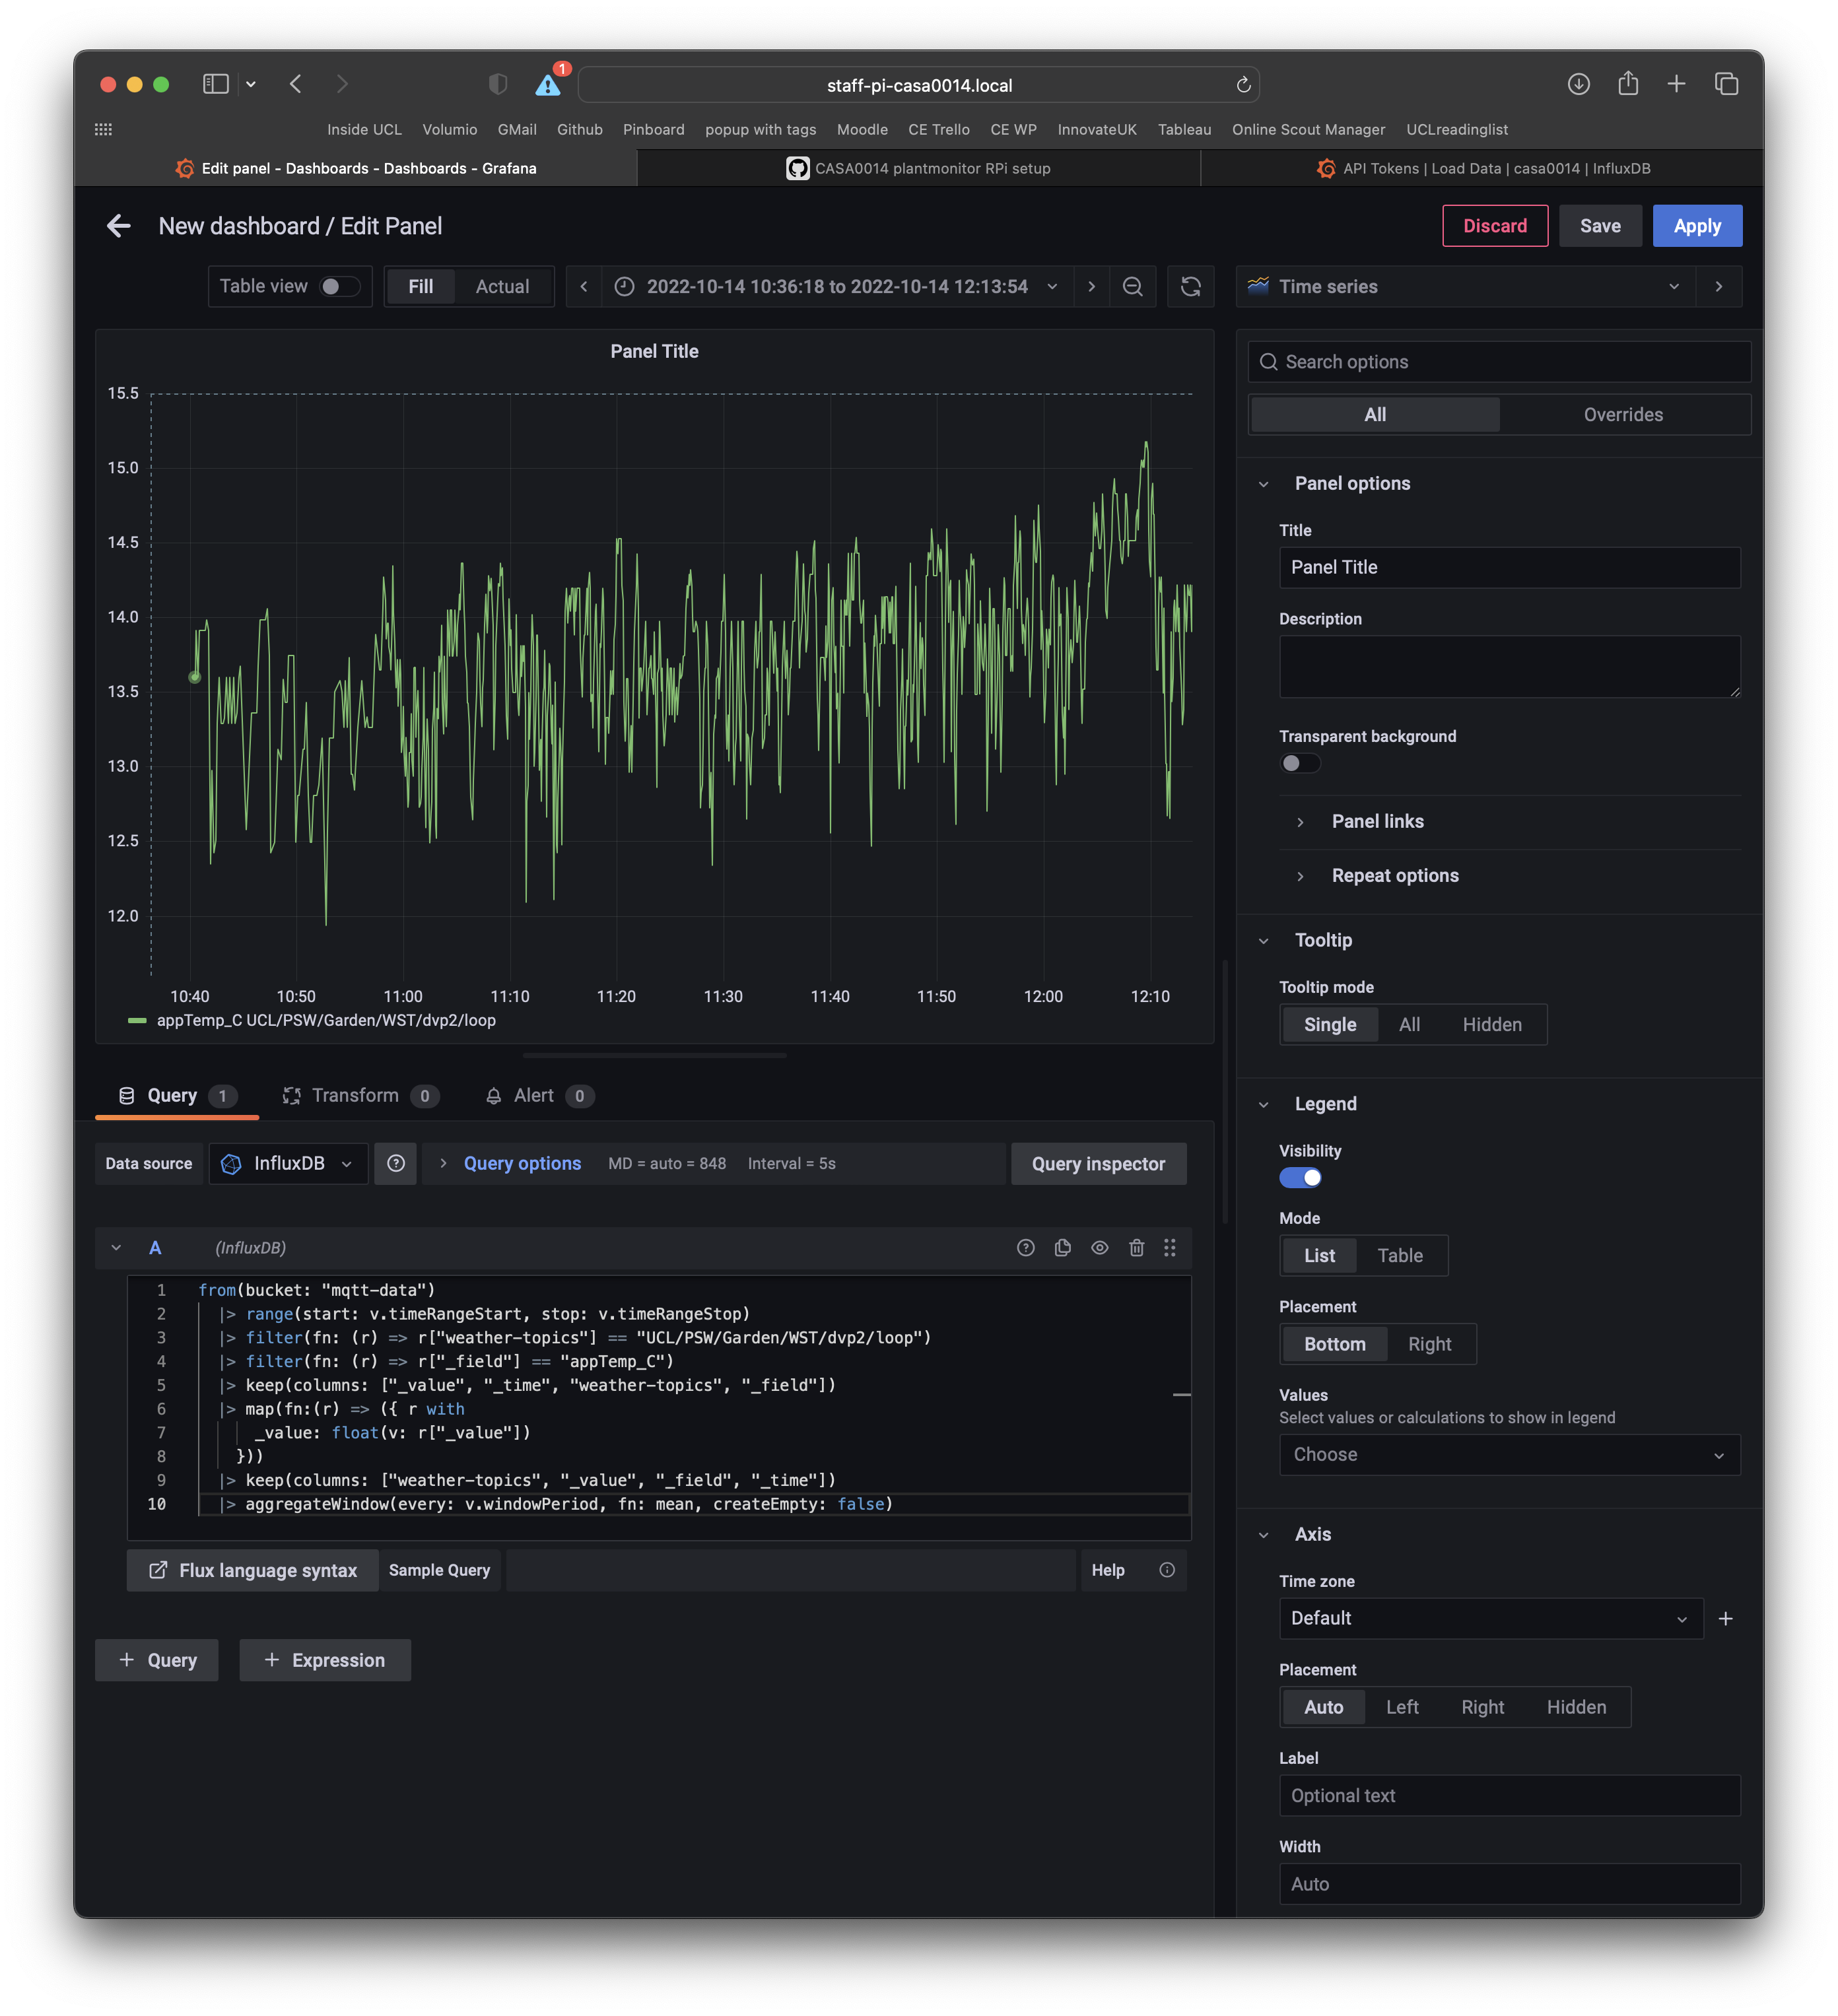
The Flux query language enables you to make some interesting graphs and charts but does require a little time to explore and get used to the syntax. You need to start thinking in terms of filtering down the data in the Buckets where timestamped data has tags, topics, measurements and values associated with them. To get started use the previous queries, copied below, to get started.
Make sure to click Apply and Save (top right). You can also play with the graph settings to change the styles, add a panel title etc.
CE weather station data...
from(bucket: "mqtt-data")
  |> range(start: v.timeRangeStart, stop: v.timeRangeStop)
  |> filter(fn: (r) => r["weather-topics"] == "UCL/OPS/Garden/WST/dvp2/loop")
  |> filter(fn: (r) => r["_field"] == "appTemp_C")
  |> keep(columns: ["_value", "_time", "weather-topics", "_field"])
  |> map(fn:(r) => ({ r with
      _value: float(v: r["_value"])
    }))
  |> keep(columns: ["weather-topics", "_value", "_field", "_time"])
  |> aggregateWindow(every: v.windowPeriod, fn: mean, createEmpty: false)
Endnote.
Sometimes if you mess up your RPi set-up it is easier to just rebuild from scratch. This GIST based on a previous version of these instructions is a bash script to install the TIG stack on RPi4 (steps 11, 12, 13). Remember you would need to change the token values etc for your particular configuration.