In this workshop you will learn:
- how to set-up and connect the Feather Huzzah ESP8266 Wifi
- how to publish sensor data to an MQTT server
- how to save and share your work on GitHub
- how to build a home made soil moisture sensor
- how to store data on a RPi gateway
- how to visualise time series data
This workshop is broken down into a few phases:
- setting up Feather Huzzah ESP8266 Wifi
- getting familiar with MQTT and data flowing across the web
- building your own plant monitoring system
We assume you have the Arduino IDE If not, get it.
Download and install MQTTBox and / or MQTT Explorer We will use this to inspect data travelling through a MQTT server. (The images in this tutorial use MQTTBox but MQTT Explorer is really useful for temporarily seeing values stored locally in memory).
Create a new repo on GitHub for this project.
Buy or borrow a plant We always need more plants in our lives - what will you choose?
First off - launch the Arduino IDE and plug in your Huzzah to a USB port!
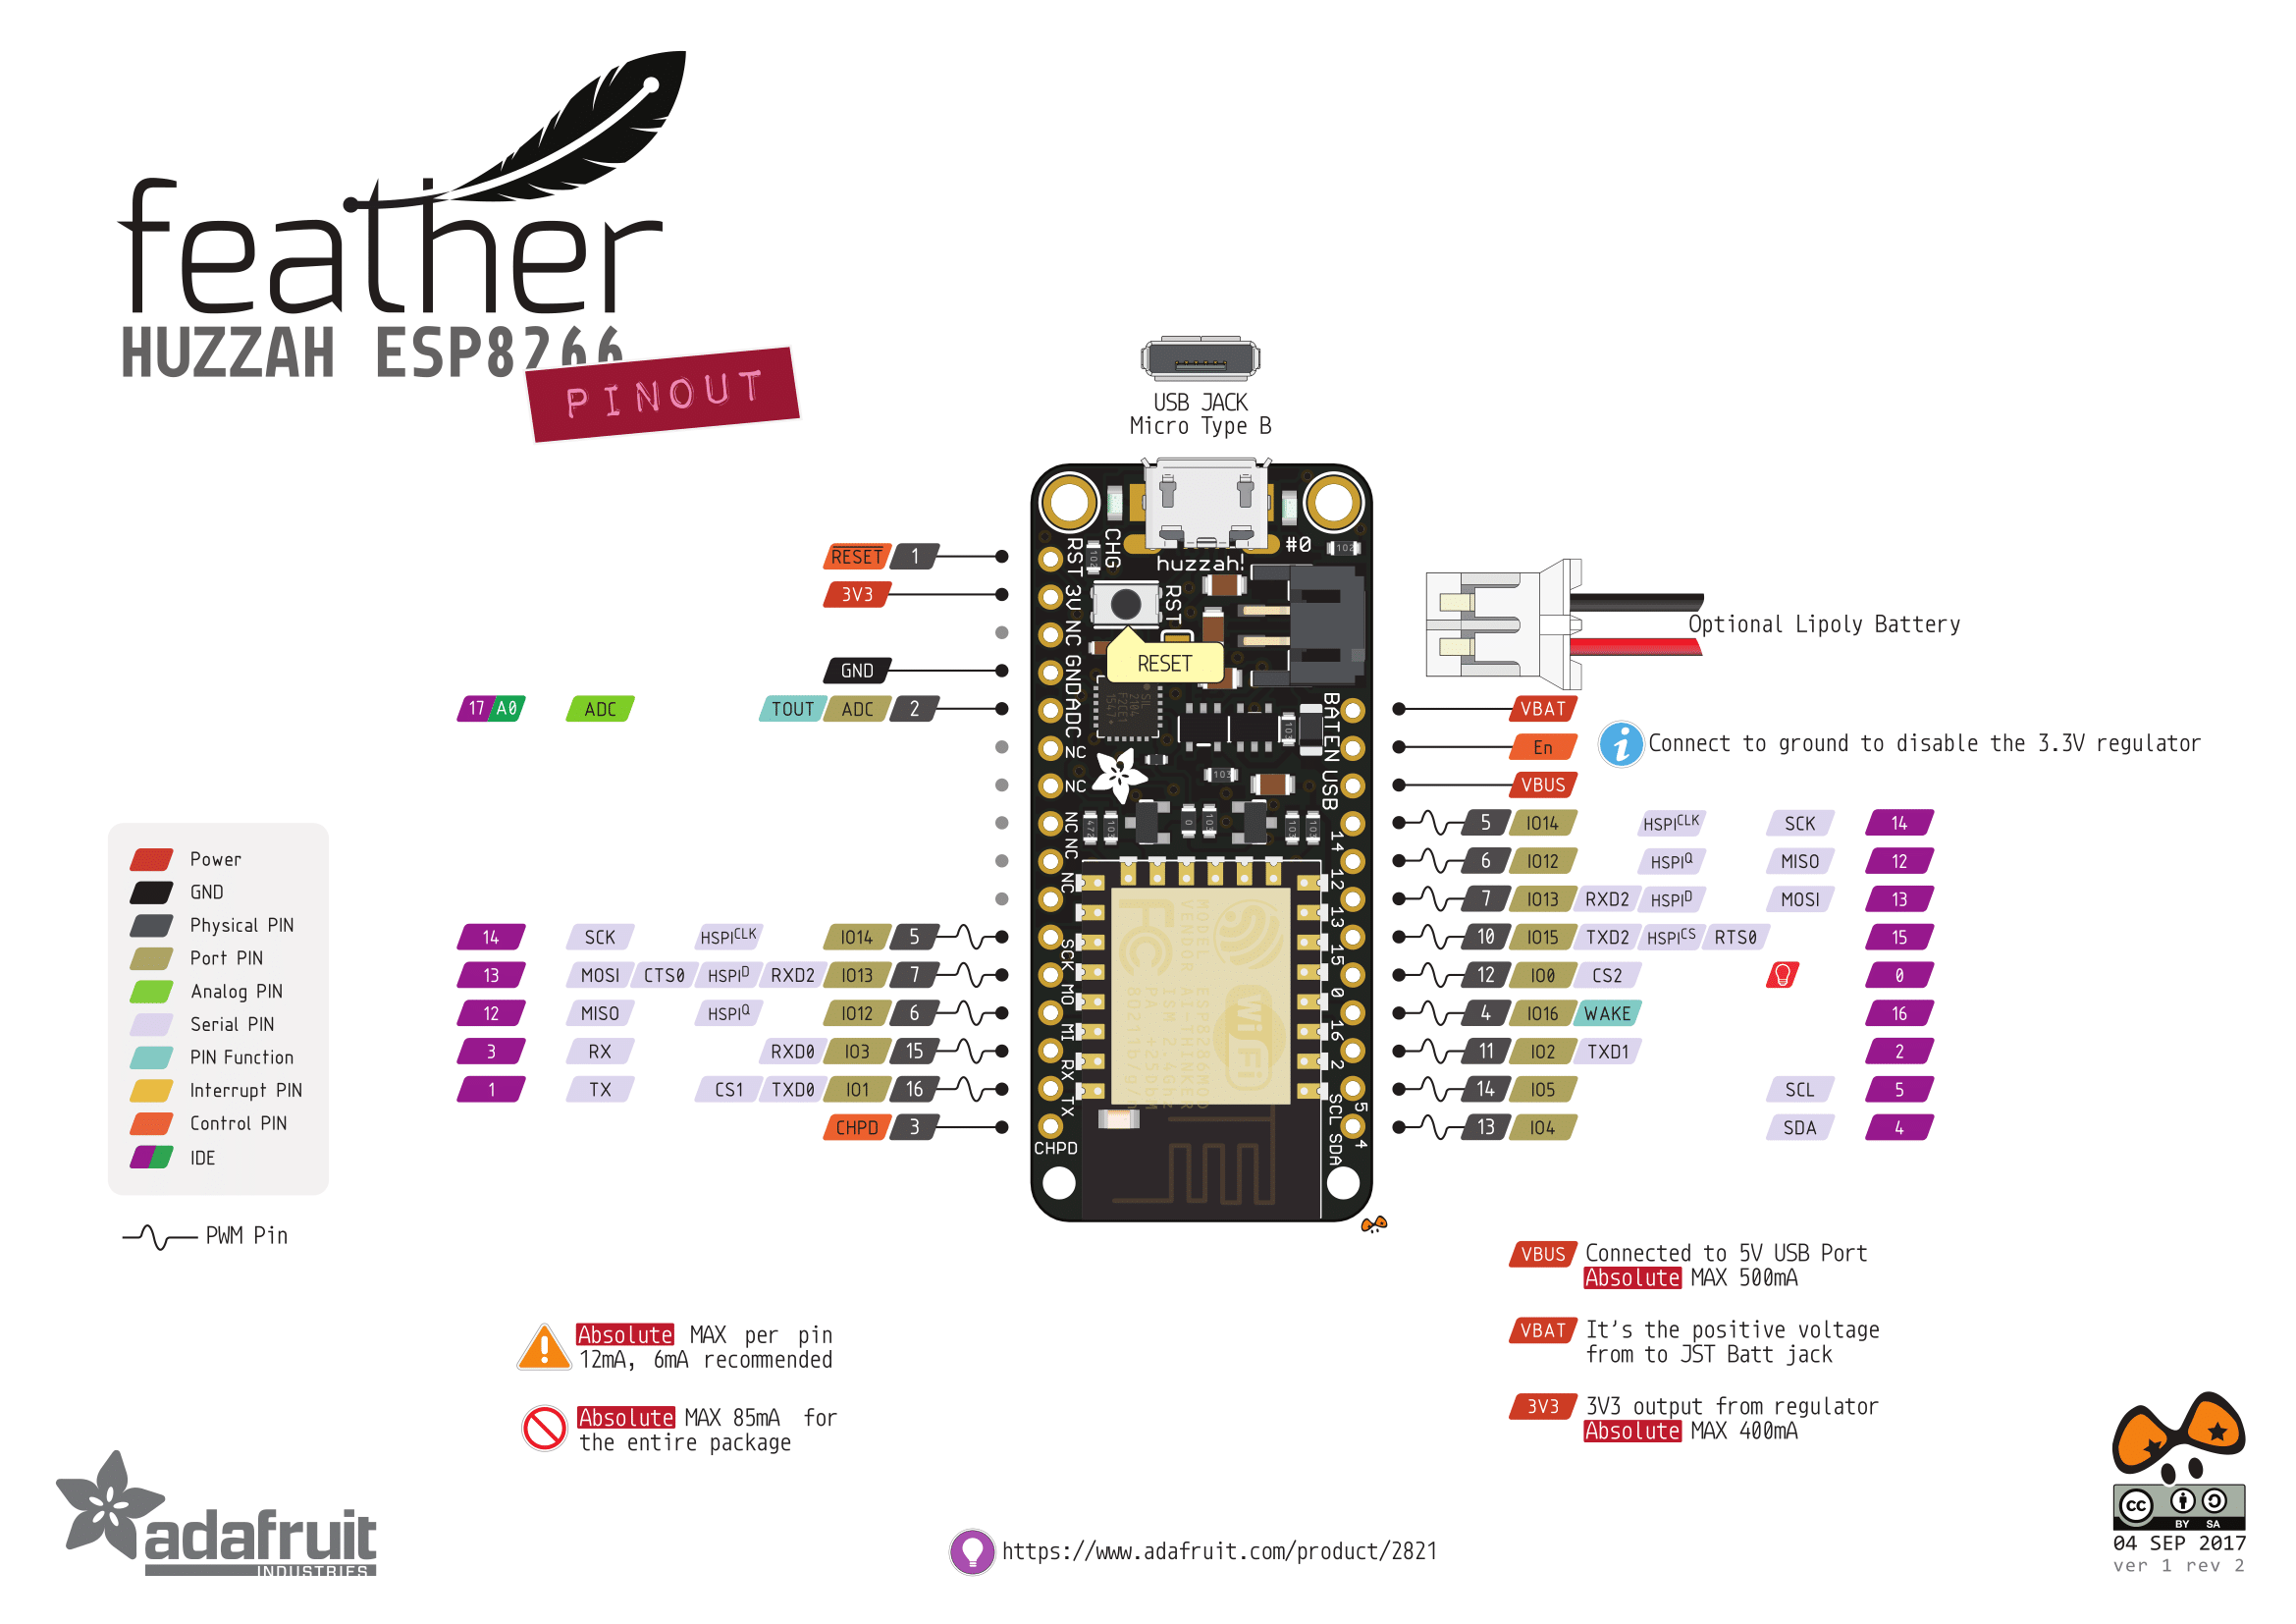
Adafruit have a great overview of the board and pin layout etc which is worth a browse.
You may first have to install the CP2104 driver and the board package (the latter is shown below).
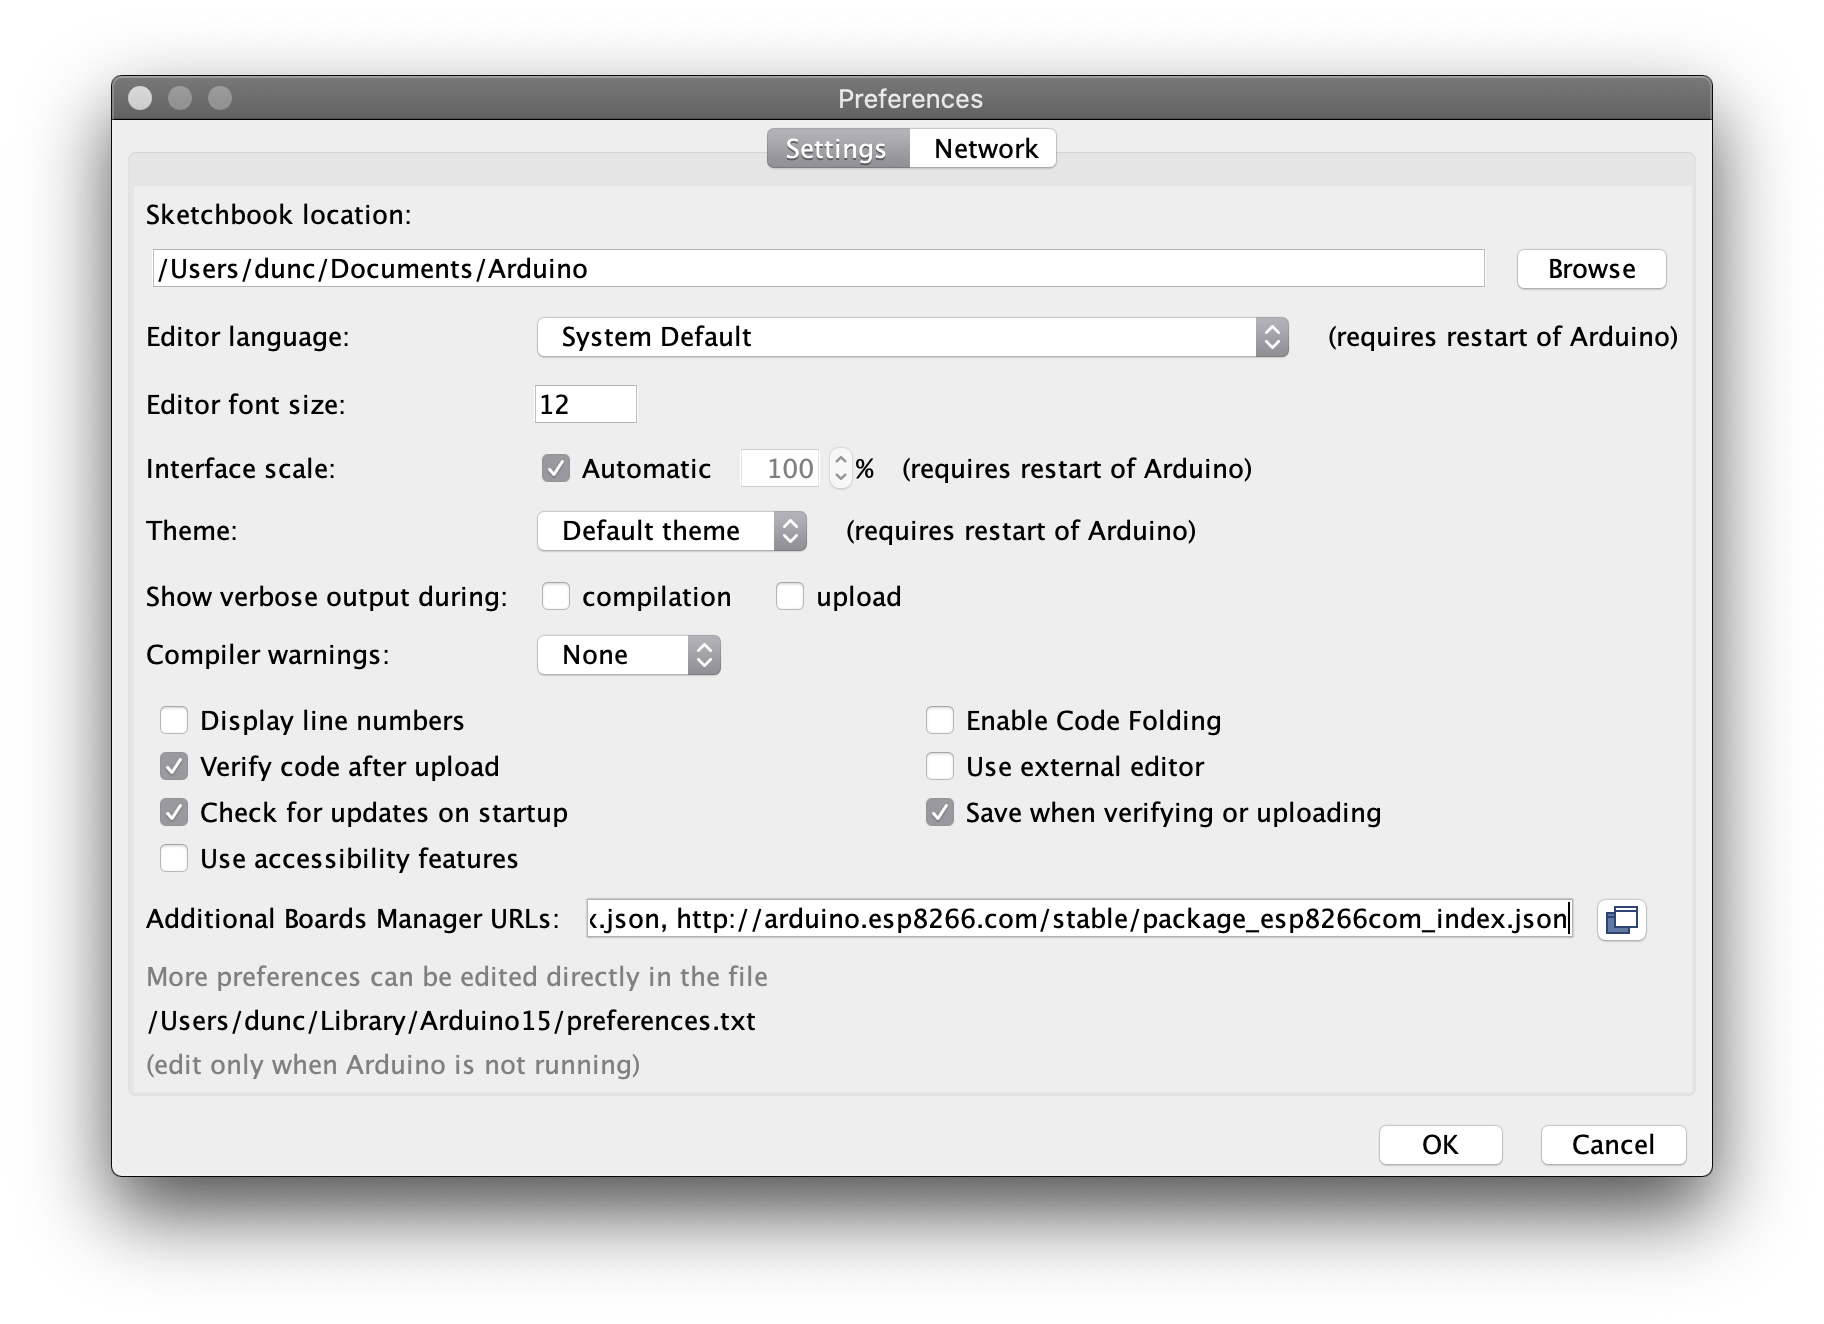 Add the Url to the Additional Board Manager URLs section, seperate with a comma if there are mutliple URLs.
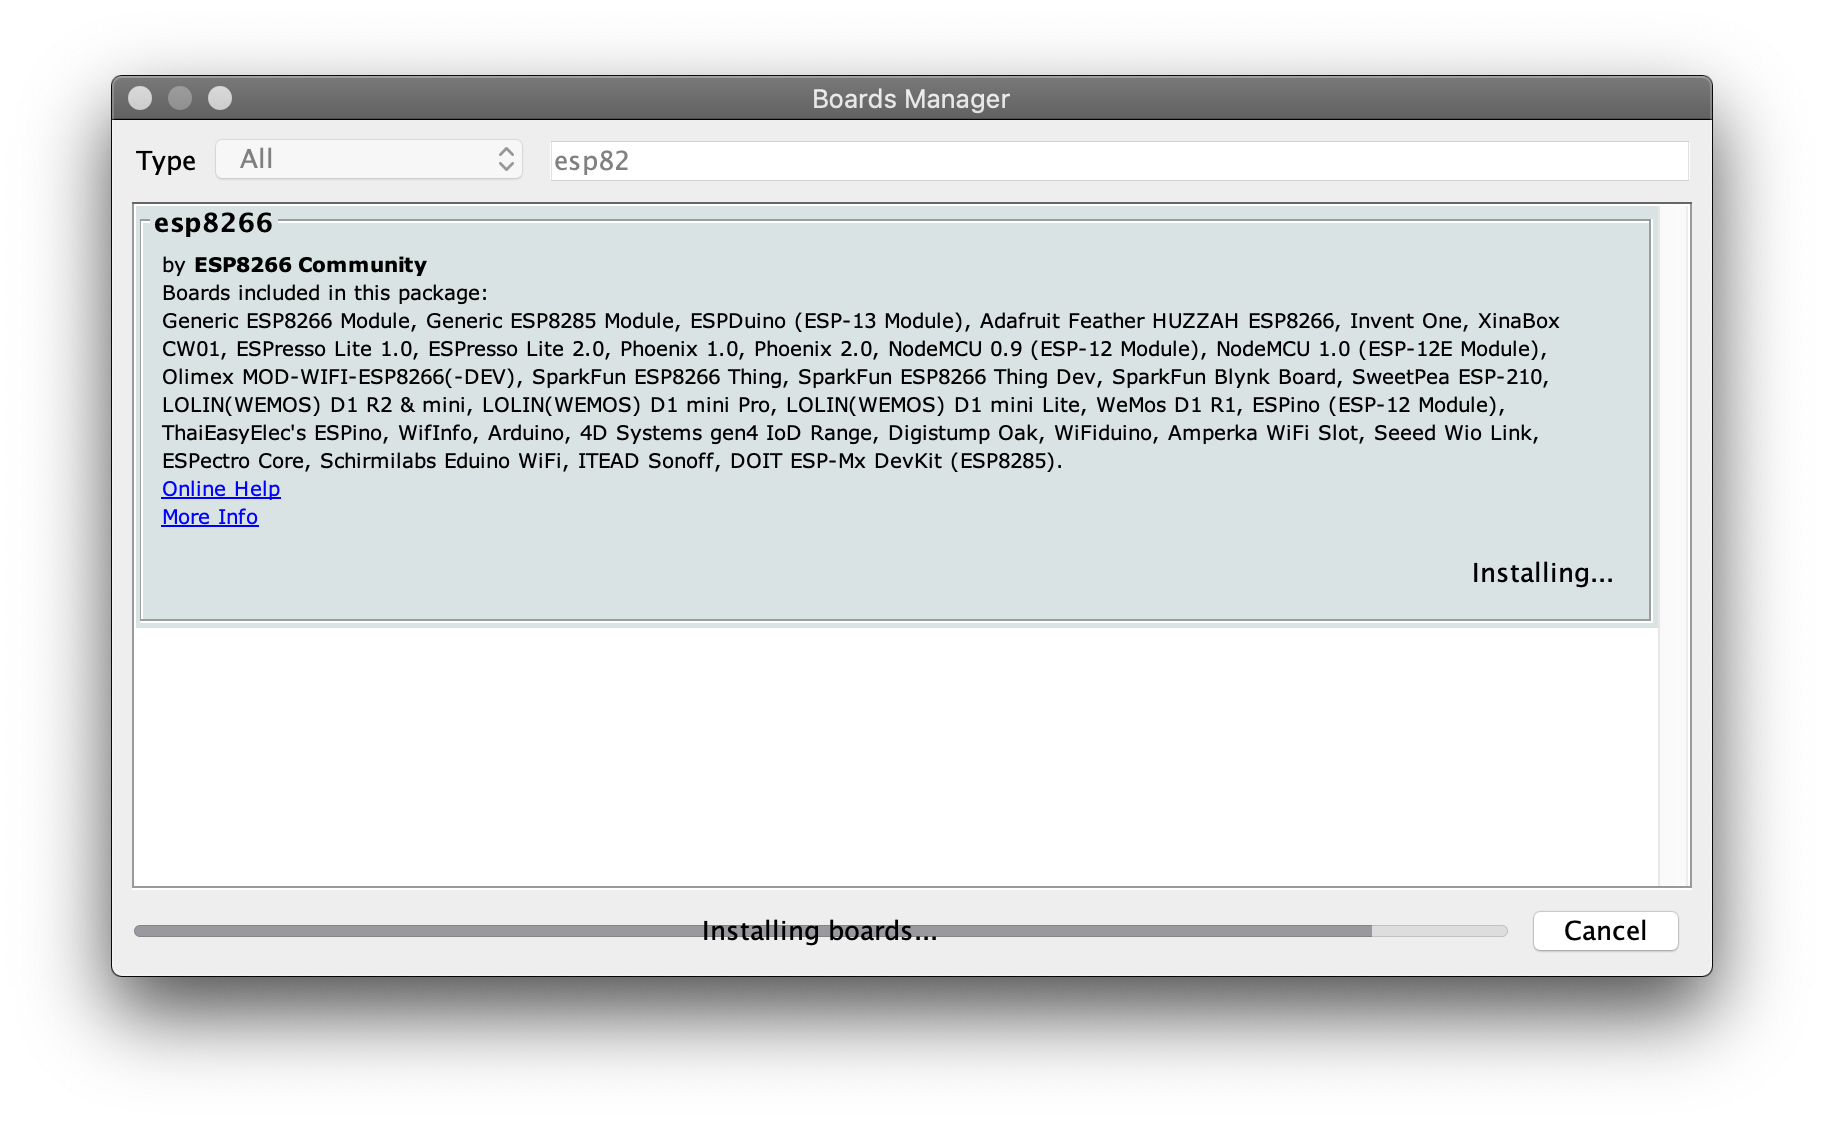
Installing via board manager - notice all the other ESP8266 boards supported.
Once you can get the blink example working jump to the next page.
A key attribute of this board is that it has Wifi! In this section we will get it connected to the internet. Open up a new blank Arduino sketch and we will step through adding the code needed. If the sketch has a template setup and loop function select all text and delete, we want to start with a bloank file. We recommend you add in some comments as you go to remember what the code you are adding is doing.
Wifi Test Connection Sketch
We need to include the ESP8266WiFi library to access code that others have already written that makes it easier for us to connect to the internet.
Next you will need to add in the lab wifi network and password. We also declare here a web host we are connecting to retrieve some test data.
#include <ESP8266WiFi.h>

const char* ssid     = "SSID here";
const char* password = "password here";
const char* host = "iot.io";
At the start of the Setup function we open a connection to the Serial port so that we can print out debug info via the Serial monitor. We then request a connection to the wifi network.
void setup() {
  Serial.begin(115200);
  delay(100);

  // We start by connecting to a WiFi network
  Serial.println();
  Serial.print("Connecting to ");
  Serial.println(ssid);
  WiFi.begin(ssid, password);
The While loop will run continuously while there is NOT a connection to the access point we are requesting. Why do we print a . to the Serial monitor?
Exiting the while loop means we have a connection so we print some data about the connection including the IP address of the Huzzah.
  while (WiFi.status() != WL_CONNECTED) {
    delay(500);
    Serial.print(".");
  }

  Serial.println("");
  Serial.println("WiFi connected");
  Serial.println("IP address: ");
  Serial.println(WiFi.localIP());
}
In the main sketch loop we start by trying to make a connection to the host server (the web site specified in the global variables). We use the WiFiClient class to construct a client, define the port it should connect via, and then try to establish a connection. If the connection fails then an error message is shown and the function is terminated at this point - meaning the sketch ends since we are in the main loop.
void loop() {
  delay(5000);

  Serial.println("-------------------------------");
  Serial.print("Connecting to ");
  Serial.println(host);

  // Use WiFiClient class to create TCP connections
  WiFiClient client;
  const int httpPort = 80;
  if (!client.connect(host, httpPort)) {
    Serial.println("connection failed");
    return;
  }
In the section below we compose the URI for the web page we want to query and then make a GET request to that URI passing in some headers.
  // We now create a URI for the request
  String url = "/data/index.html";
  Serial.print("Requesting URL: ");
  Serial.println(host + url);

  // This will send the request to the server
  client.print(String("GET ") + url + " HTTP/1.1\r\n" +
               "Host: " + host + "\r\n" +
               "Connection: close\r\n\r\n");

  delay(500);
This final section of code takes the response from the server and prints out the received information including the page meta data and the content of the page itself.
  // Read all the lines of the reply from server and print them to Serial
  while(client.available()){
    String line = client.readStringUntil('\r');
    Serial.print(line);
  }

  Serial.println();
  Serial.println("closing connection");
}
In the next section we will make use of the fact we can connect to the internet to set the time on the Huzzah. Like most Arduino's it doesn't have a built in clock so each time it starts up, you need to tell it the time.
The Arduino has a concept of time but it is based upon the number of milliseconds since the board started. It is therefore useful to be able to grab the time from an NTP server on the internet and define the time for applications when knowing what date or time a measurement was taken would be useful. In this example we use the ezTime library which should be installed through the Sketch>Include Library>Manage Libraries menu. A copy of the sketch is described below and is available in full on GitHub.
We include the ezTime library (and the wifi one from the previous example). Remember to set the SSID and password for the Lab. Finally we create a Timezone instance called GB - since we are in London.
#include <ESP8266WiFi.h>
#include <ezTime.h>

const char* ssid     = "ssid here";
const char* password = "your password here";

Timezone GB;
The setup below is pretty much the same as the previous sketch.
void setup() {
  Serial.begin(115200);
  delay(100);

  // We start by connecting to a WiFi network
  Serial.println();
  Serial.print("Connecting to ");
  Serial.println(ssid);
  WiFi.begin(ssid, password);

  while (WiFi.status() != WL_CONNECTED) {
    delay(500);
    Serial.print(".");
  }

  Serial.println("");
  Serial.println("WiFi connected");
  Serial.println("IP address: ");
  Serial.println(WiFi.localIP());
The code below calls a ezTime function called waitForSync which brokers a connection to the NTP server. We have not specified which one to use, so are using a default setting. The library docs have advance settings which allow you to define your preferences. The function returns once a valid date time has been acquired from the NTP server and is saved into the UTC object. To get our localised time we define our location as Europe/London and then print the current value to the serial monitor. (Note: to find out which timezone reference to use take a look at the tz database)
  waitForSync();

  Serial.println("UTC: " + UTC.dateTime());

  GB.setLocation("Europe/London");
  Serial.println("London time: " + GB.dateTime());

}
Finally in the main loop we wait a second and the print the current time in hour minute second format. The dateTime function can take a number of parameters to define the formatting of the date time object.
void loop() {
  delay(1000);
  Serial.println(GB.dateTime("H:i:s")); // UTC.dateTime("l, d-M-y H:i:s.v T")
}
Your Arduino can now tell the time! Imagine how you could use this to update an interesting LED display...
In the second part of this workshop we are going to focus on getting measurements to the outside world. To do this we will be sending data to a MQTT server.
We are going to build on the previous Arduino wifi sketch but since that is all working fine it is useful to save a copy and start working on that. We called our new file testMQTT and the full code for this example is on GitHub. But remember we learn through doing so don't just copy paste - work through the description below.
Since we are ‘building' on the shoulders of giants, someone has already written a great MQTT library we can use to do a lot of the connection setup. We will be using the PubSubClient library. Follow the instructions to install the library.
To start we need to include this library, declare some variables used throughout the sketch and set-up the user names and passwords for the wifi access point and the mqtt broker. In the lab we will use the CE-Hub ssid and the password will be on the whiteboard. For the mqtt_server you can use any test server you like, but we recommend using mqtt.cetools.org and the student user account (password on whiteboard). Notice in the code snippet below we use a #include "arduino_secrets.h" file to store the usernames and passwords - this is so that we can use gitignore to exclude adding those files to the GitHub repository.
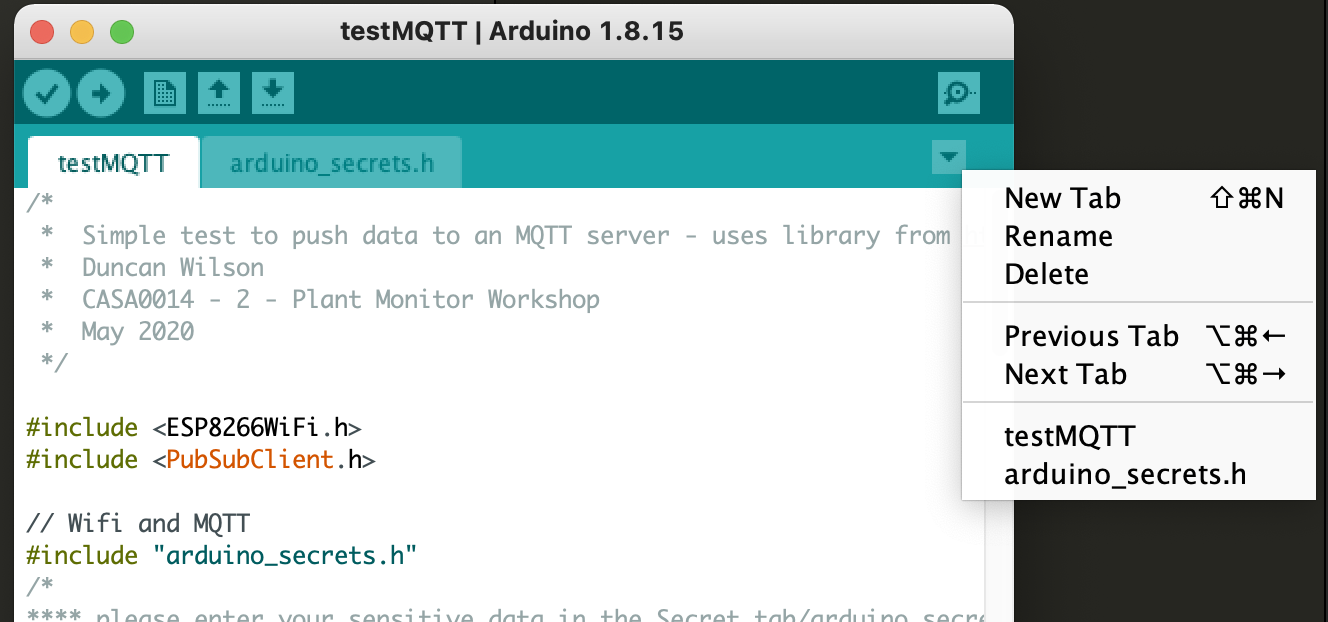
To add the arduino_secrets.h file to your code click on the little arrow at the top of the sketch and add new tab as per image below. Then add in the four #defines... lines in the comments with the real user names and passwords.
#define SECRET_SSID "xxx"
#define SECRET_PASS "xxx"
#define SECRET_MQTTUSER "xxx"
#define SECRET_MQTTPASS "xxx"
Similar to the WiFiClient in the previous example we need to define a PubSubClient that will handle the MQTT messages. Note it passes in the WiFiClient just defined as the connection.
The other three variables should become clearer as you go through the code in the setup and sendMQTT function.
#include <ESP8266WiFi.h>
#include <PubSubClient.h>

// Wifi and MQTT
#include "arduino_secrets.h"
/*
**** please enter your sensitive data in the Secret tab/arduino_secrets.h
**** using format below

#define SECRET_SSID "ssid name"
#define SECRET_PASS "ssid password"
#define SECRET_MQTTUSER "user name - eg student"
#define SECRET_MQTTPASS "password";
 */

const char* ssid     = SECRET_SSID;
const char* password = SECRET_PASS;
const char* mqttuser = SECRET_MQTTUSER;
const char* mqttpass = SECRET_MQTTPASS;


const char* mqtt_server = "enter mqtt url";

WiFiClient espClient;
PubSubClient client(espClient);
long lastMsg = 0;
char msg[50];
int value = 0;
In the setup function we add the following to initialise the builtin LED (so that we can turn the LED on and off via MQTT) and initialise the MQTT client (note that we are using port 1884 since we will be using a username and password to connect to the broker).
pinMode(BUILTIN_LED, OUTPUT);
digitalWrite(BUILTIN_LED, HIGH);

client.setServer(mqtt_server, 1884);
client.setCallback(callback);
In the main loop we add a call to the function sendMQTT which is defined below.
sendMQTT();
Alongside the setup and loop functions we create a new function called sendMQTT. This helps to make the programme more readable as it gets larger. The first if statement checks to see if a connection has already been established to the MQTT server and if not it creates one. The loop functions checks to see if any new messages have been received by the client. We then increment a value which is keeping track of how many messages have been sent to the server. Finally we send a message to both the Serial monitor so that we can see what has been sent and the client (using client.publish with the topic student/CASA0014/plant/ucjtdjw and the mesage msg).
void sendMQTT() {

  if (!client.connected()) {
    reconnect();
  }
  client.loop();
  ++value;
  snprintf (msg, 50, "hello world #%ld", value);
  Serial.print("Publish message: ");
  Serial.println(msg);
  client.publish("student/CASA0014/plant/ucjtdjw", msg);
}
The reconnect function called above is a while loop that repeats until the client is connected. It creates a random clientId and then if connected it calls the client.pulish function to send a message "hello world" to the topic "test". It also calls the client.subscribe function to subscribe to the topic "inTopic". On the next page we will show how to send an "inTopic" to the device.
void reconnect() {
  // Loop until we're reconnected
  while (!client.connected()) {    // while not (!) connected....
    Serial.print("Attempting MQTT connection...");
    // Create a random client ID
    String clientId = "ESP8266Client-";
    clientId += String(random(0xffff), HEX);

    // Attempt to connect
    if (client.connect(clientId.c_str(), mqttuser, mqttpass)) {
      Serial.println("connected");
      // ... and subscribe to messages on broker
      client.subscribe("student/CASA0014/plant/ucjtdjw/inTopic");
    } else {
      Serial.print("failed, rc=");
      Serial.print(client.state());
      Serial.println(" try again in 5 seconds");
      // Wait 5 seconds before retrying
      delay(5000);
    }
  }
}
The callback function holds the code to process messages that have been subscribed to by the sketch. The setCallback function is initiated in setup and passes in callback as an argument. If the client is used to subscribe to topics, a callback function must be provided in the constructor. This function is called when new messages arrive at the client.
The function takes prints the message received to the serial monitor. The if statement checks to see if the payload message is 1 and if so turns the LED on, otherwise it turns it off.
void callback(char* topic, byte* payload, unsigned int length) {
  Serial.print("Message arrived [");
  Serial.print(topic);
  Serial.print("] ");
  for (int i = 0; i < length; i++) {
    Serial.print((char)payload[i]);
  }
  Serial.println();

  // Switch on the LED if an 1 was received as first character
  if ((char)payload[0] == '1') {
    digitalWrite(BUILTIN_LED, LOW);   // Turn the LED on (Note that LOW is the voltage level
    // but actually the LED is on; this is because it is active low on the ESP-01)
  } else {
    digitalWrite(BUILTIN_LED, HIGH);  // Turn the LED off by making the voltage HIGH
  }

}
Save, compile and upload this updated sketch. On the next page we will connect to the MQTT server to check for messages coming from the device and to send messages to it.
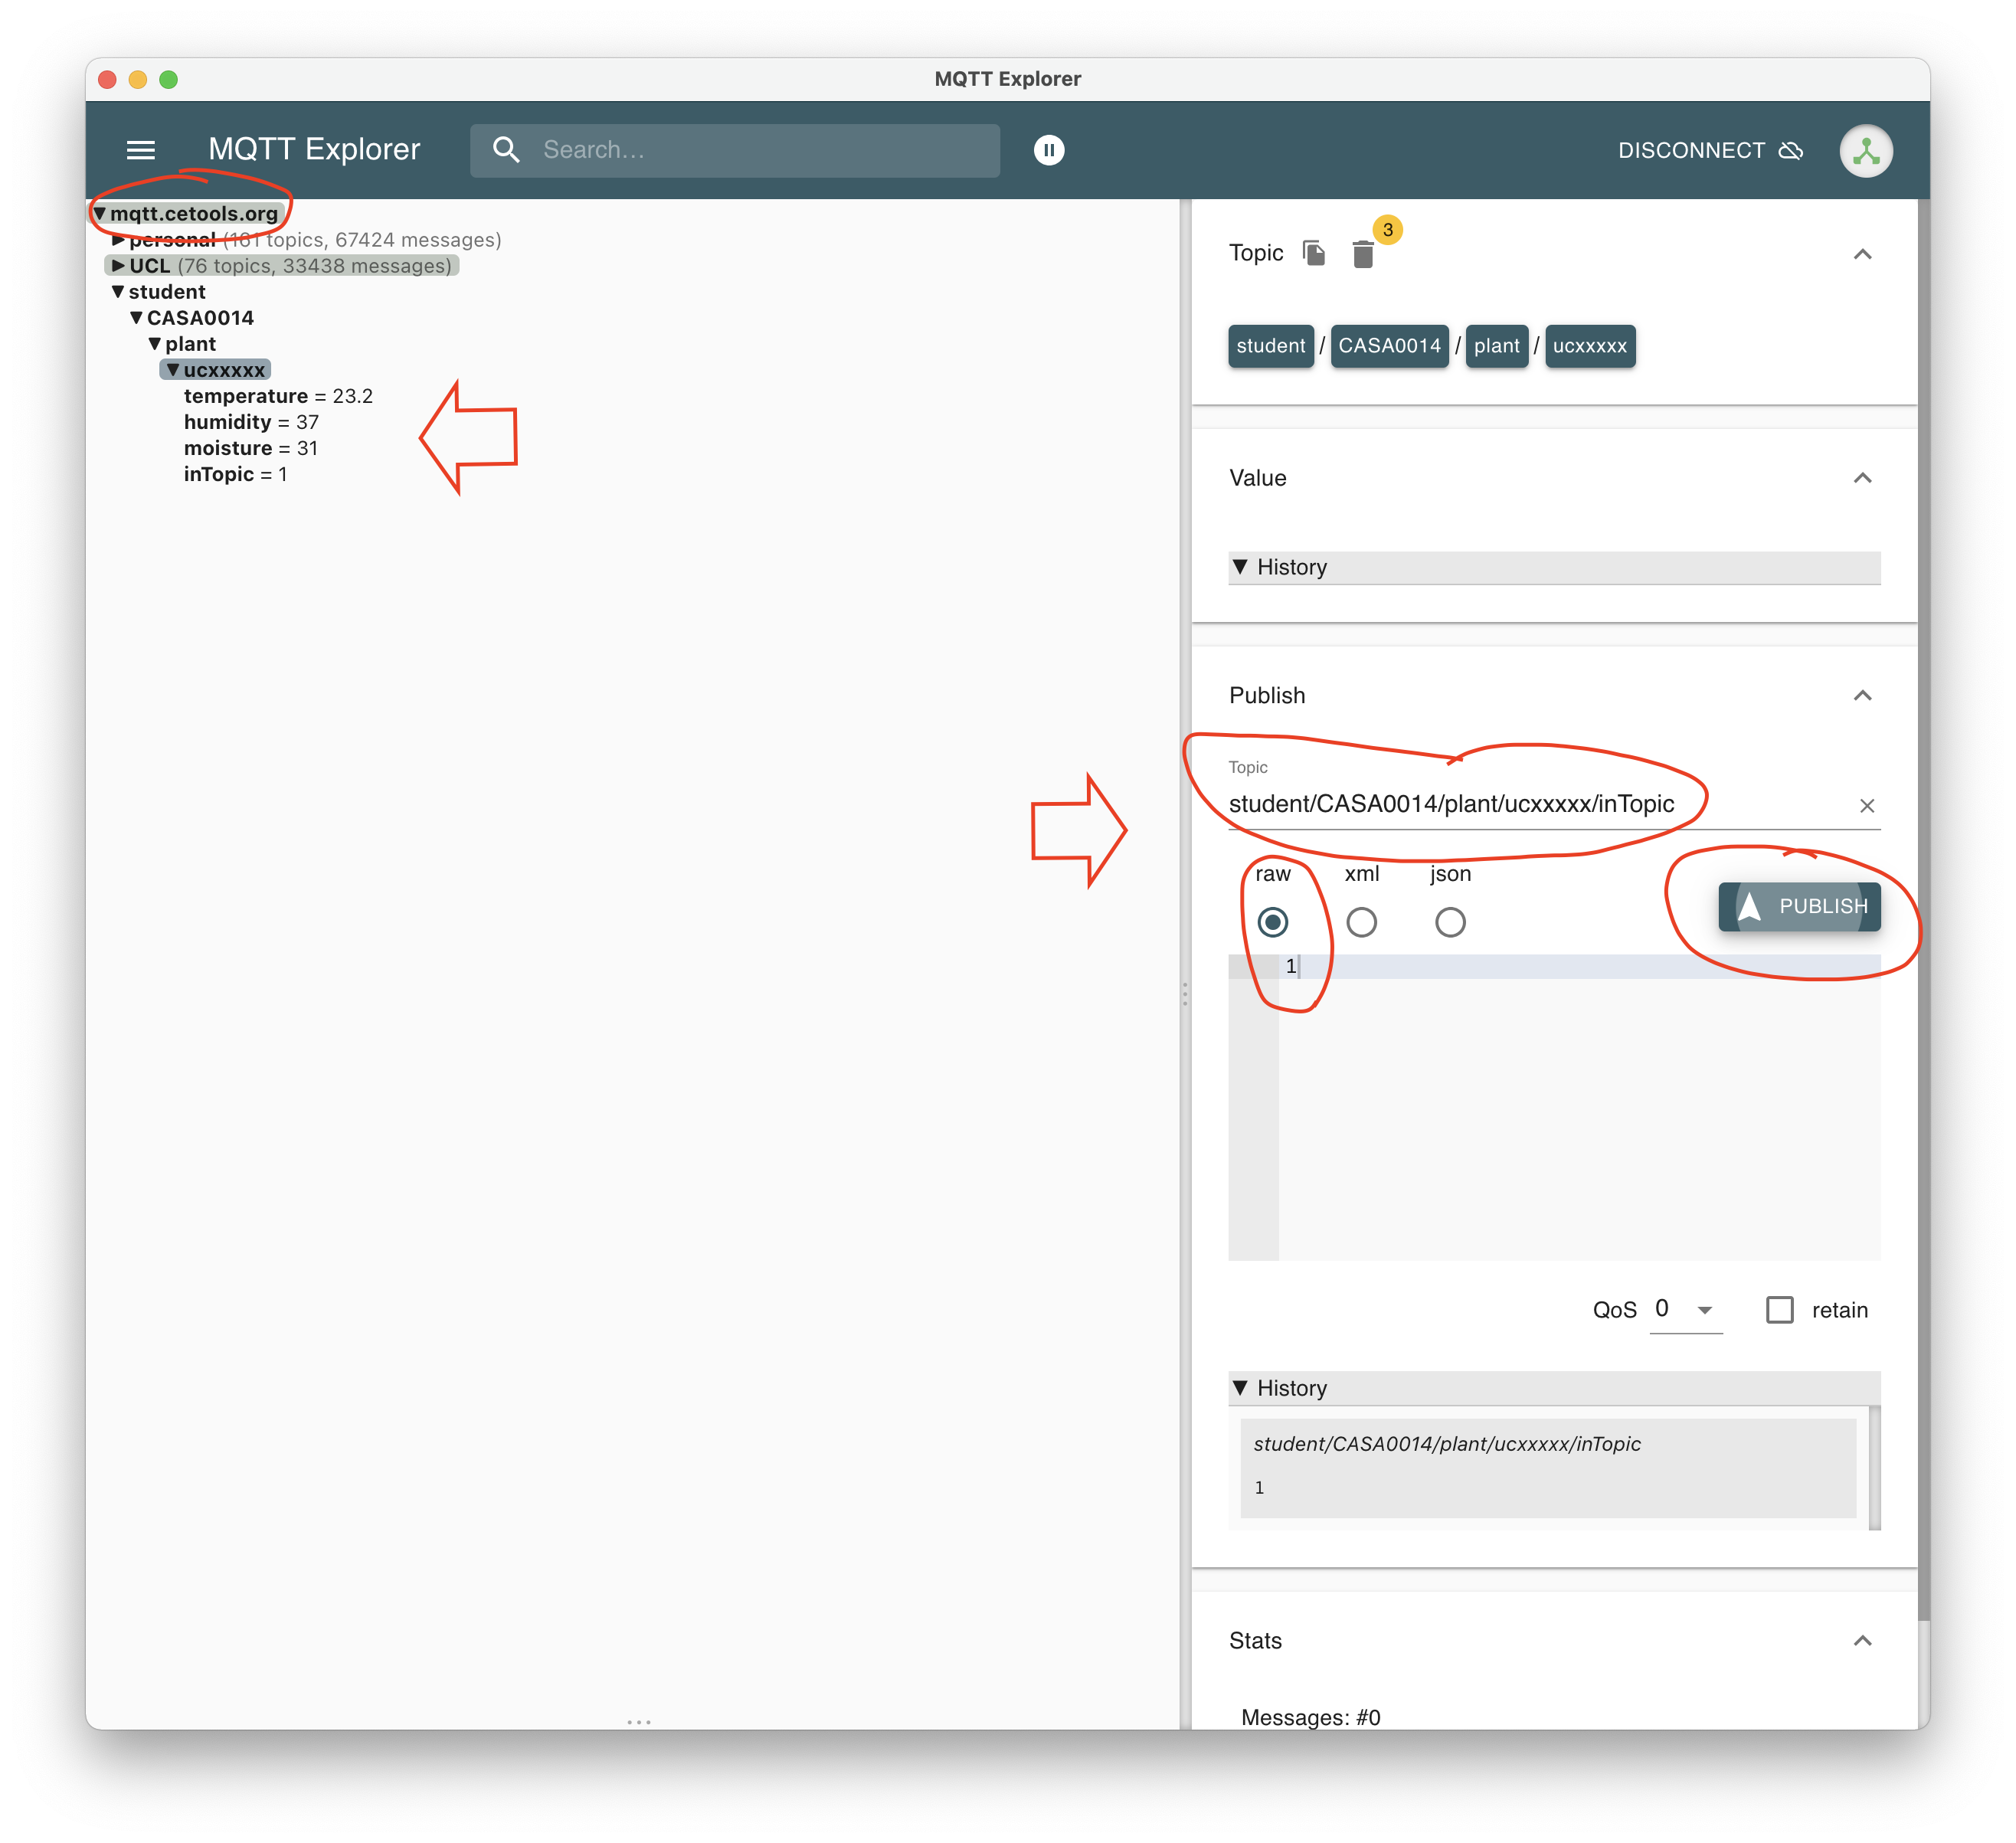
Open up MQTT Explorer or similar client. Create a new connection to the MQTT server you are using e.g mqtt.cetools.org. Under the topic student you should see all messages since MQTT explorer default to showing all topics using the syntax /# (the /# means subscribe to all information that is sent to the topic).
To see how to send a control message via MQTT create a new topic to publish. Use the topic student/CASA0014/plant/ucxxxxx/inTopic with a payload of 1 and hit publish. The built in LED on the Huzzah should now turn on. Change the payload to 0 and hit publish again. The light should now go out.
More information on syntax for topic names and topic filters is available in the awesome documentation.
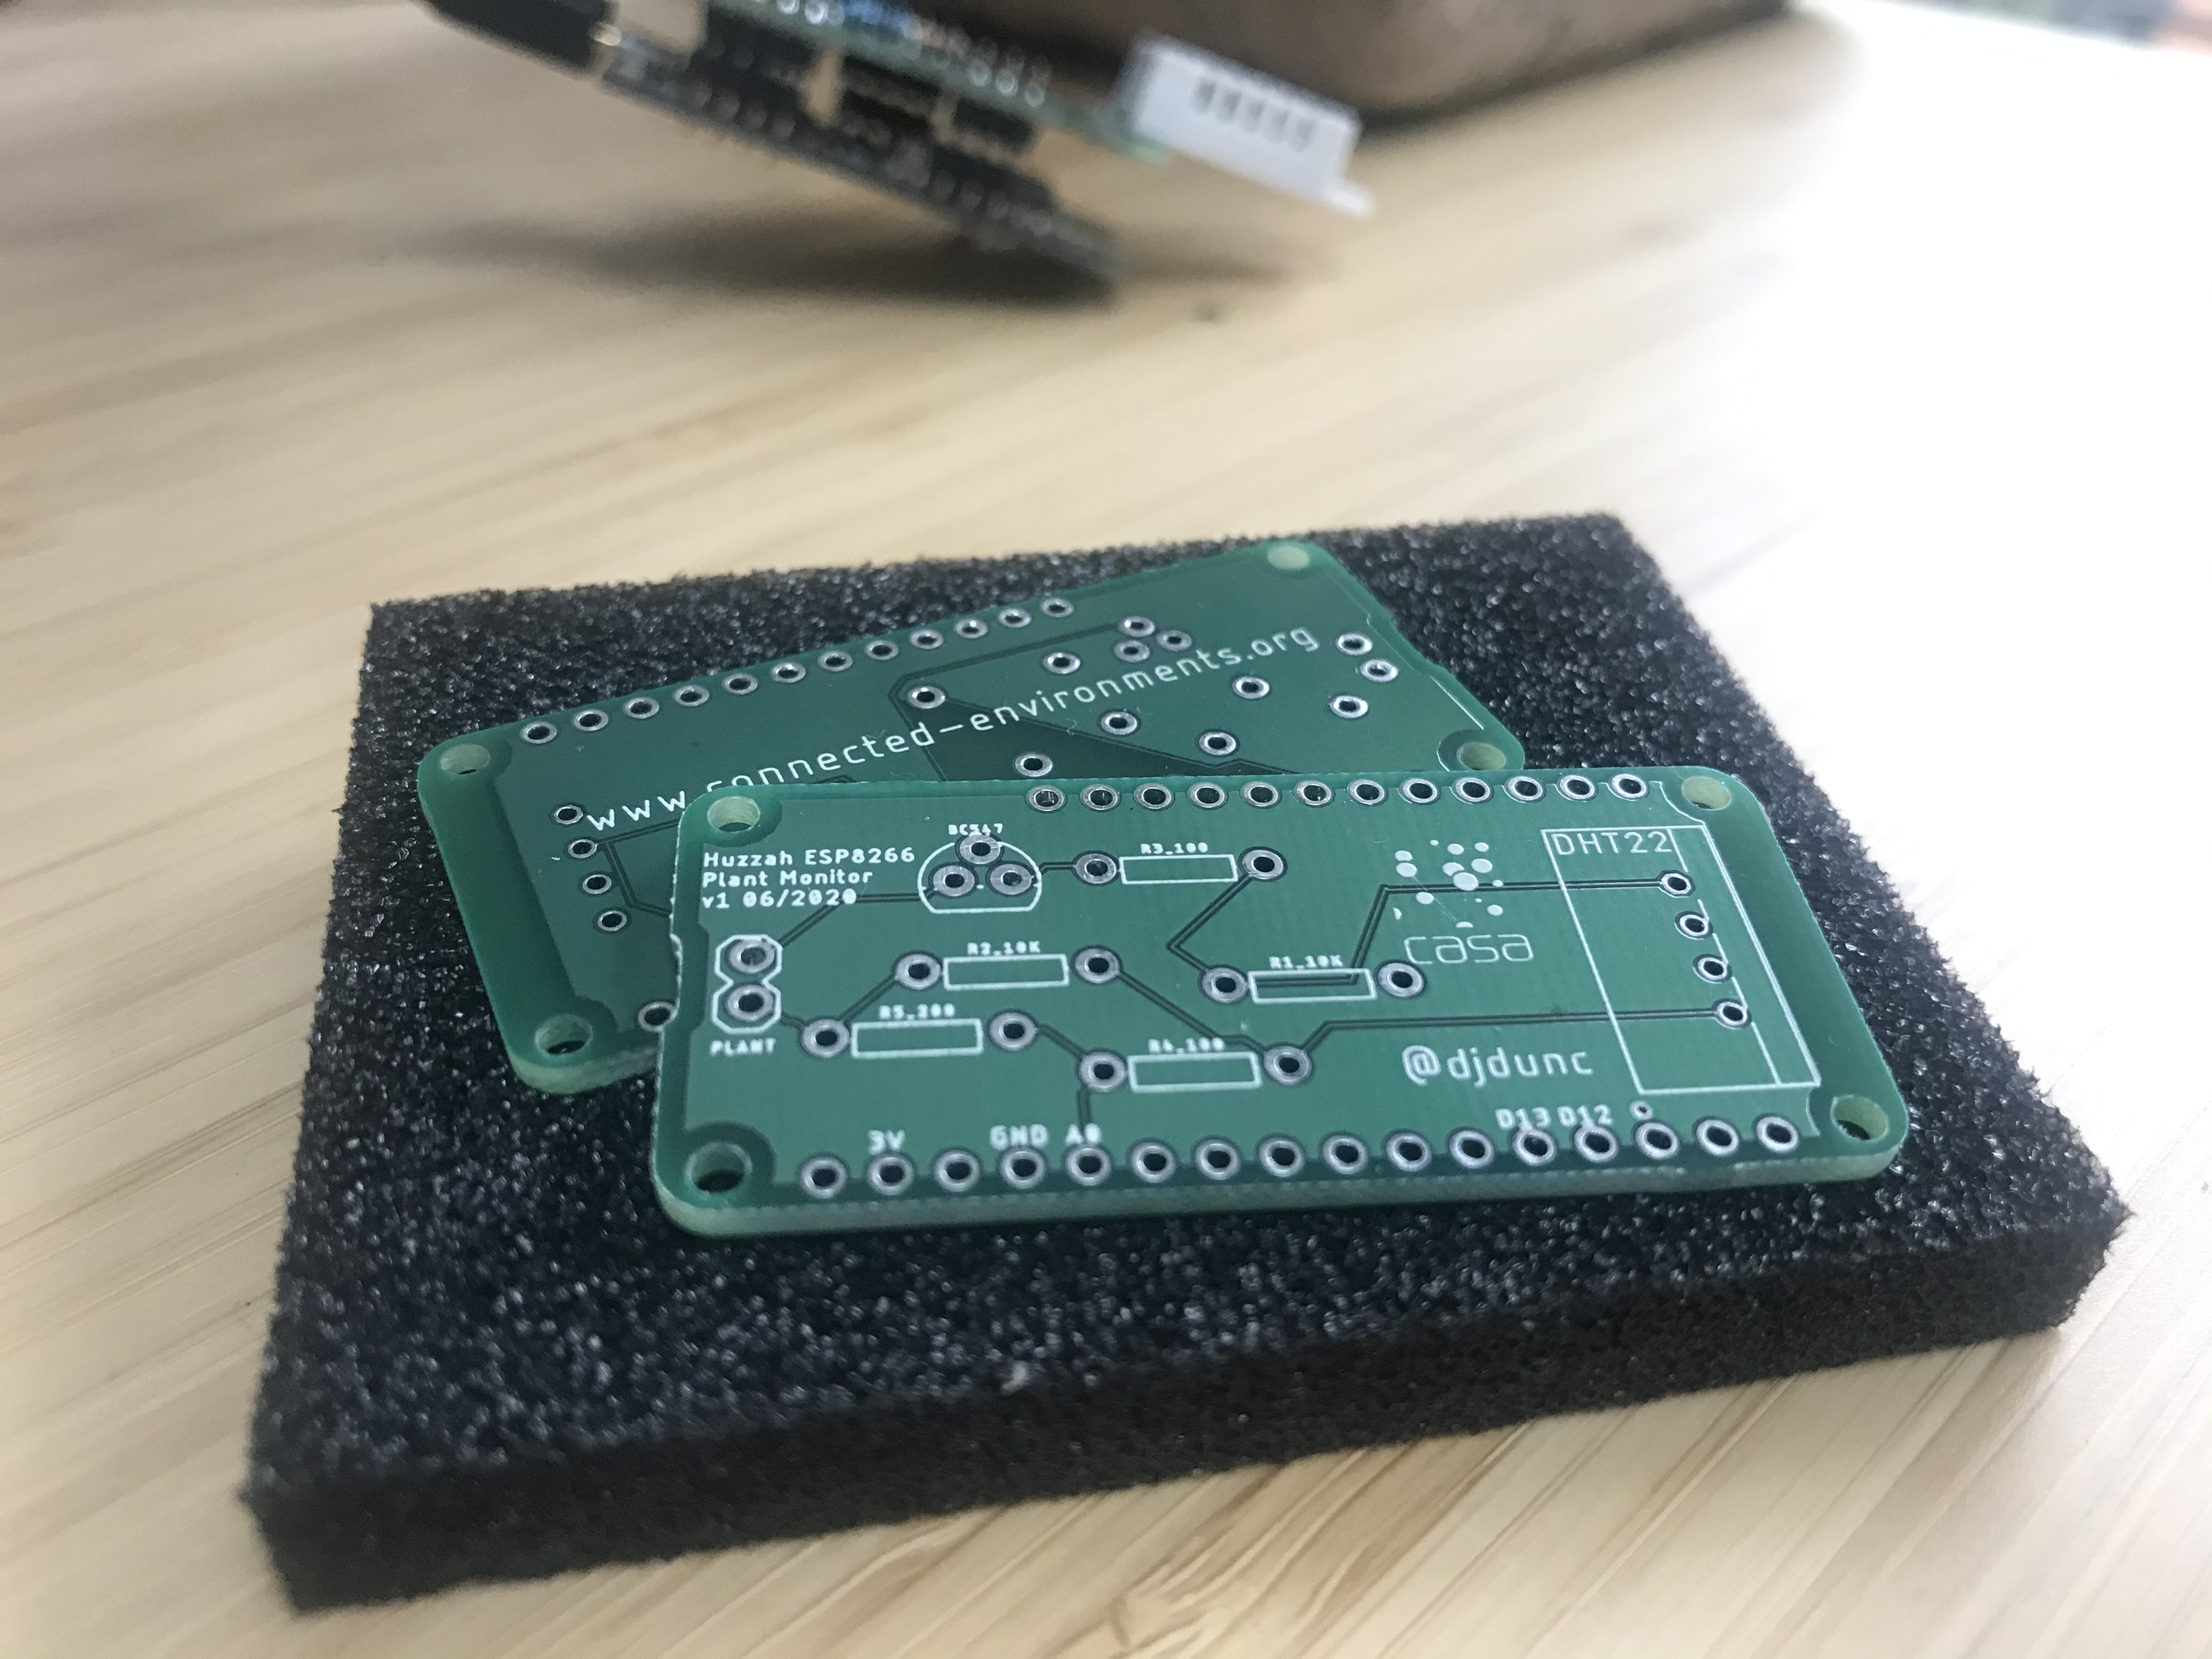
The sensors for the plant monitor are based on 2 items - a DHT22 temperature / humidity sensor and a pair of nails. Whilst the former is in a convenient, accurate and packaged form, the latter requires a little more creativity and fiddling to get it working. We will create the soil sensor first.
If you search the internet for "Arduino nails soil sensor" you get thousands of results. The basic principle is to measure the resistance of the soil between two nails a distance apart. The more moisture there is in the soil the lower the resistance. This Instructable shows the basic principle of how it works.. The theory can be quite different to the practice which is why we are using nails in this project. You will find a number of challenges whilst using the nails from electrolysis to working out what the analog reading means (hint: it's dependent on length of nails, depth in soil, type of soil, distance between nails etc.)
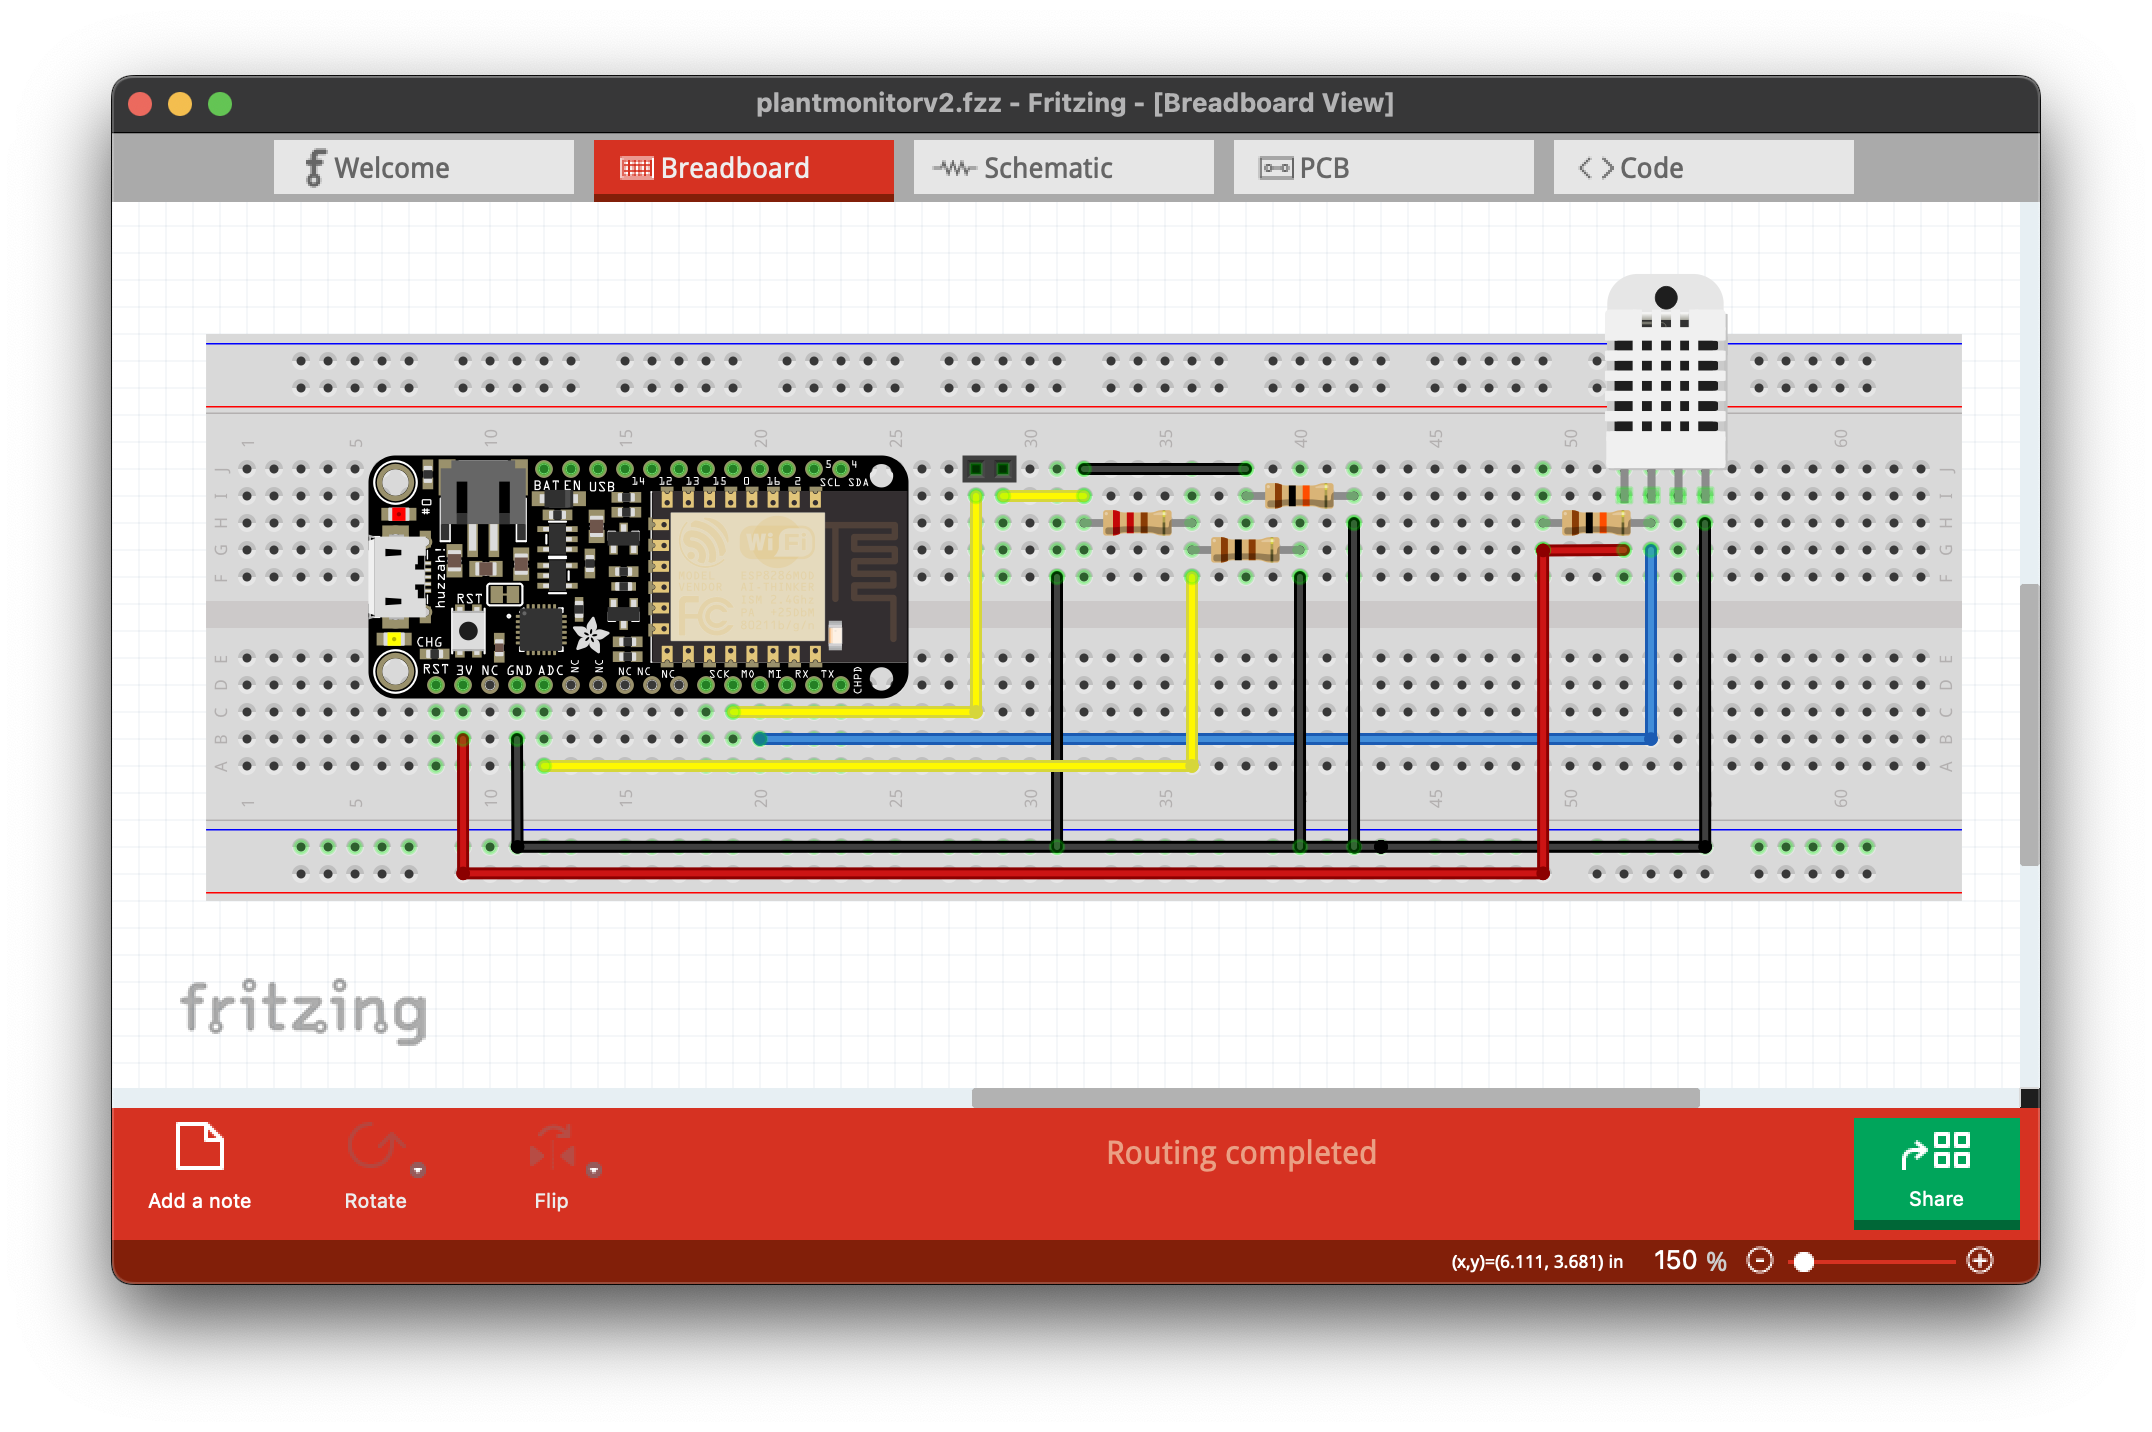
The Fritzing diagram below shows the circuit for connecting a soil sensor using 2 nails and a DHT22 sensor.
Or if a sketch / schematic of the circuit is easier to understand the following two images may help:
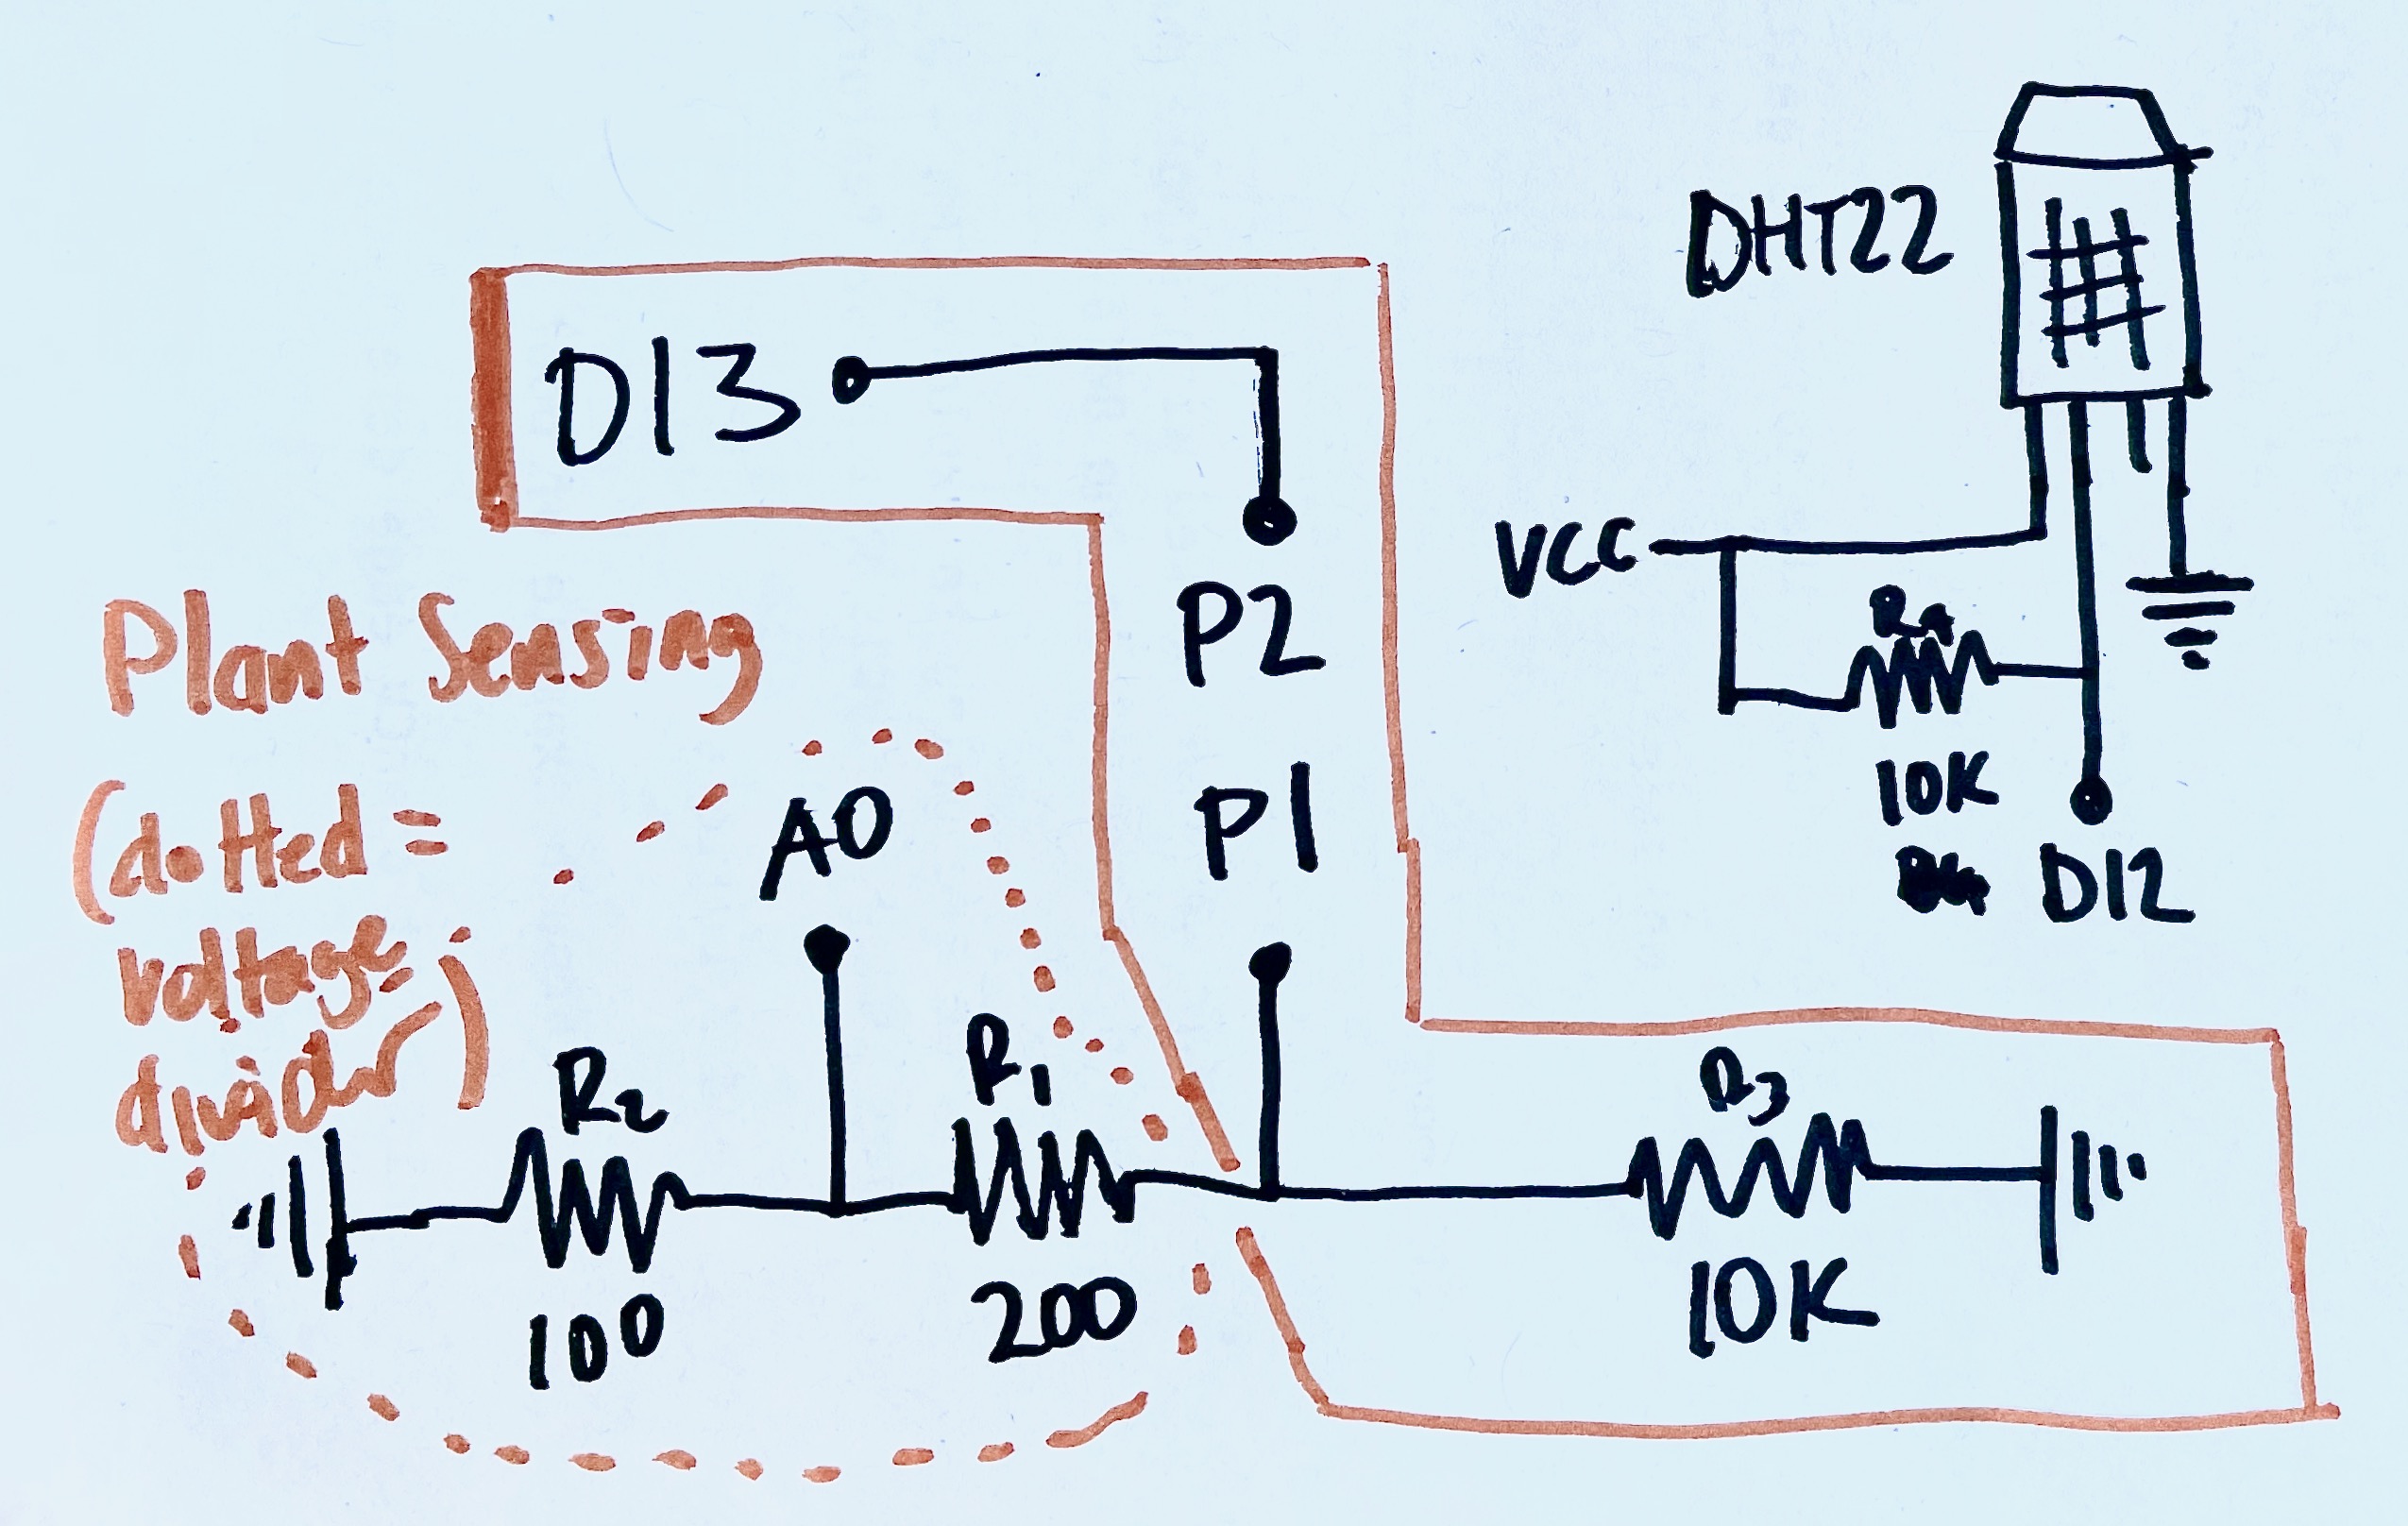
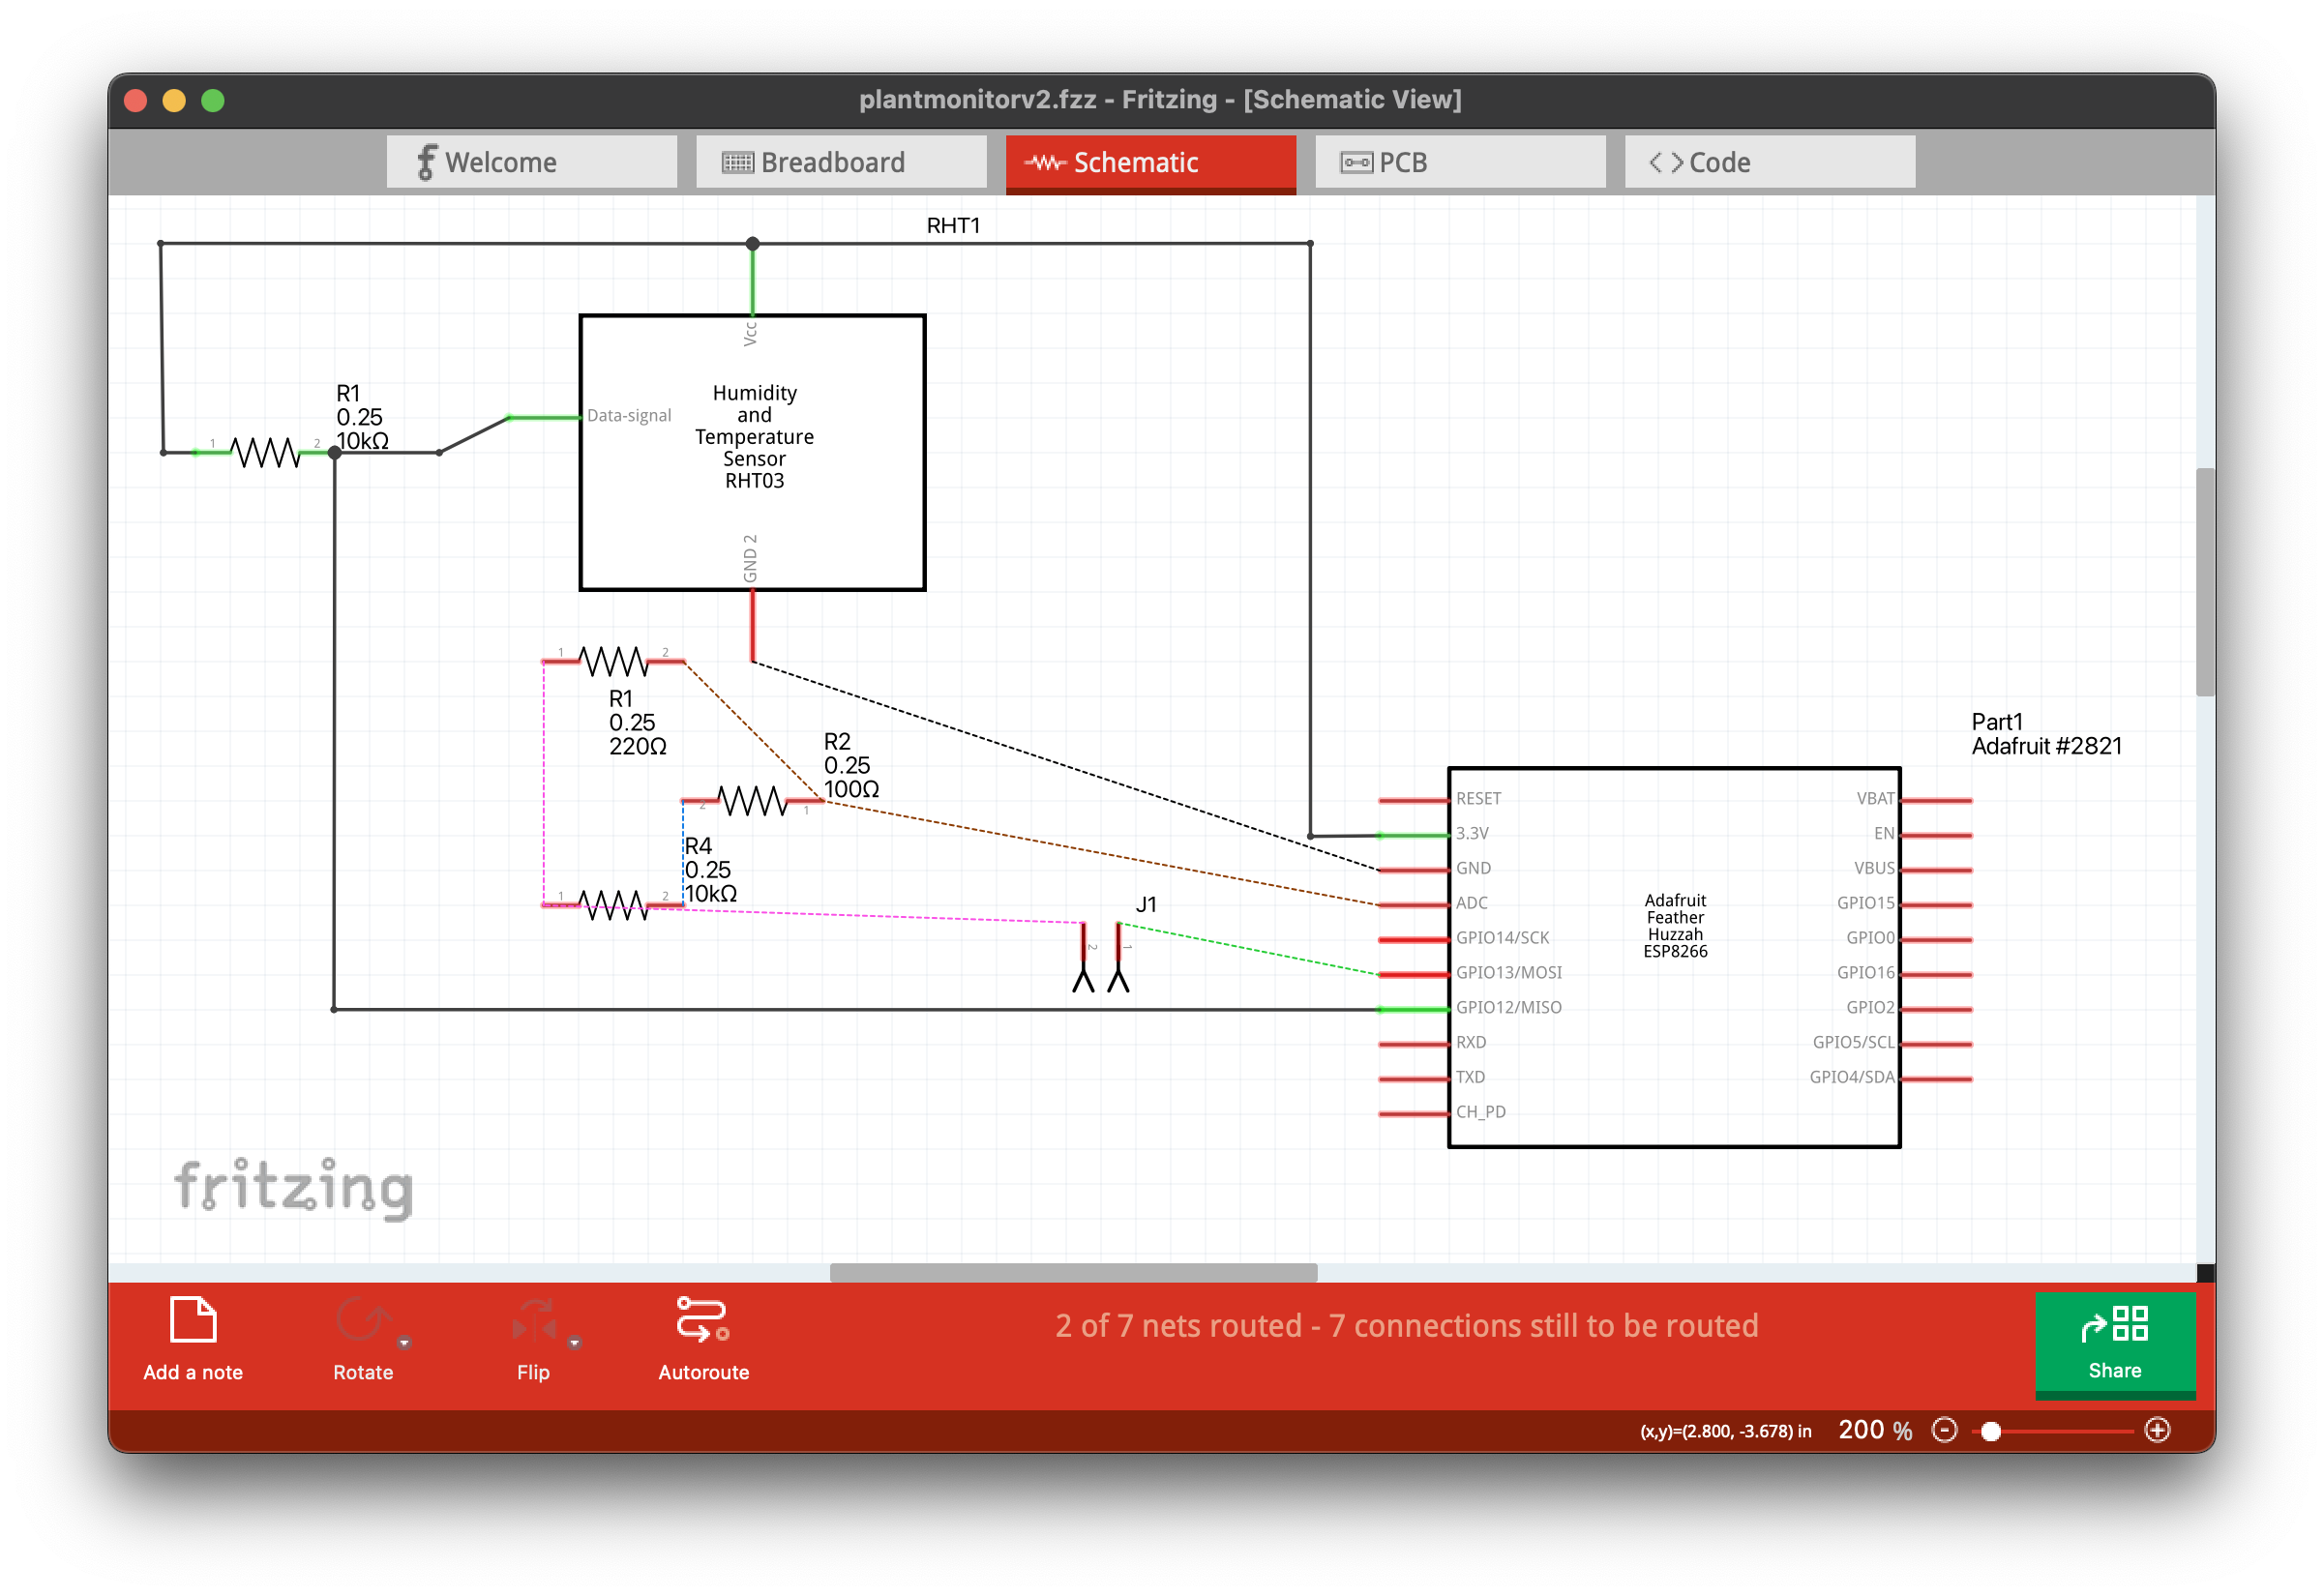
These diagrams look a little more complicated than the one shown in the Instructable above since we are doing three extra things in this circuit:
- we added the DHT22 sensor
- we added an NPN transistor so that we could turn off the voltage going to the nails to reduce electrolysis (ie we literally have a switch that turns off that part of the circuit when we are not taking a reading)
- the analog pin of the Huzzah reads at a max of 1.0V (vs the 3.3V of other Arduino boards) so we are using a voltage divider to reduce the voltage - hence 2 resistors not 1. This voltage difference is the kind of variation between boards that is quite common, can lead to hours of frustration trying to debug code and is why spec sheets are your friend! For example see the Adafruit Huzzah Pinout reference
To test the soil sensor build the circuit (feel free to connect the DHT22 sensor since we will be using that next) and upload the testMoisture script
The code below defines soilPin as A01, sets sensorVCC to pin D13 (used to control voltage flowing through the nails), calls setup to initialise the pins and then in the main loop we use a counter so that every nth loop the voltage is set high which allows a resistance to be measured on the soilPin.
uint8_t soilPin = 0; //one nail goes to +5V, the other nail goes to this analogue pin
int moisture_val;
int sensorVCC = 13;
int counter = 0;
void setup() {
Serial.begin(115200); //open serial port
pinMode(sensorVCC, OUTPUT);
digitalWrite(sensorVCC, LOW);
}
void loop() {
counter++;
if(counter> 6){ // change this value to set "not powered" time. higher number bigger gap
// power the sensor
digitalWrite(sensorVCC, HIGH);
delay(1000);
// read the value from the sensor:
moisture_val = analogRead(soilPin); // read the resistance
//stop power
digitalWrite(sensorVCC, LOW);
delay(100);
counter=0;
}
//wait
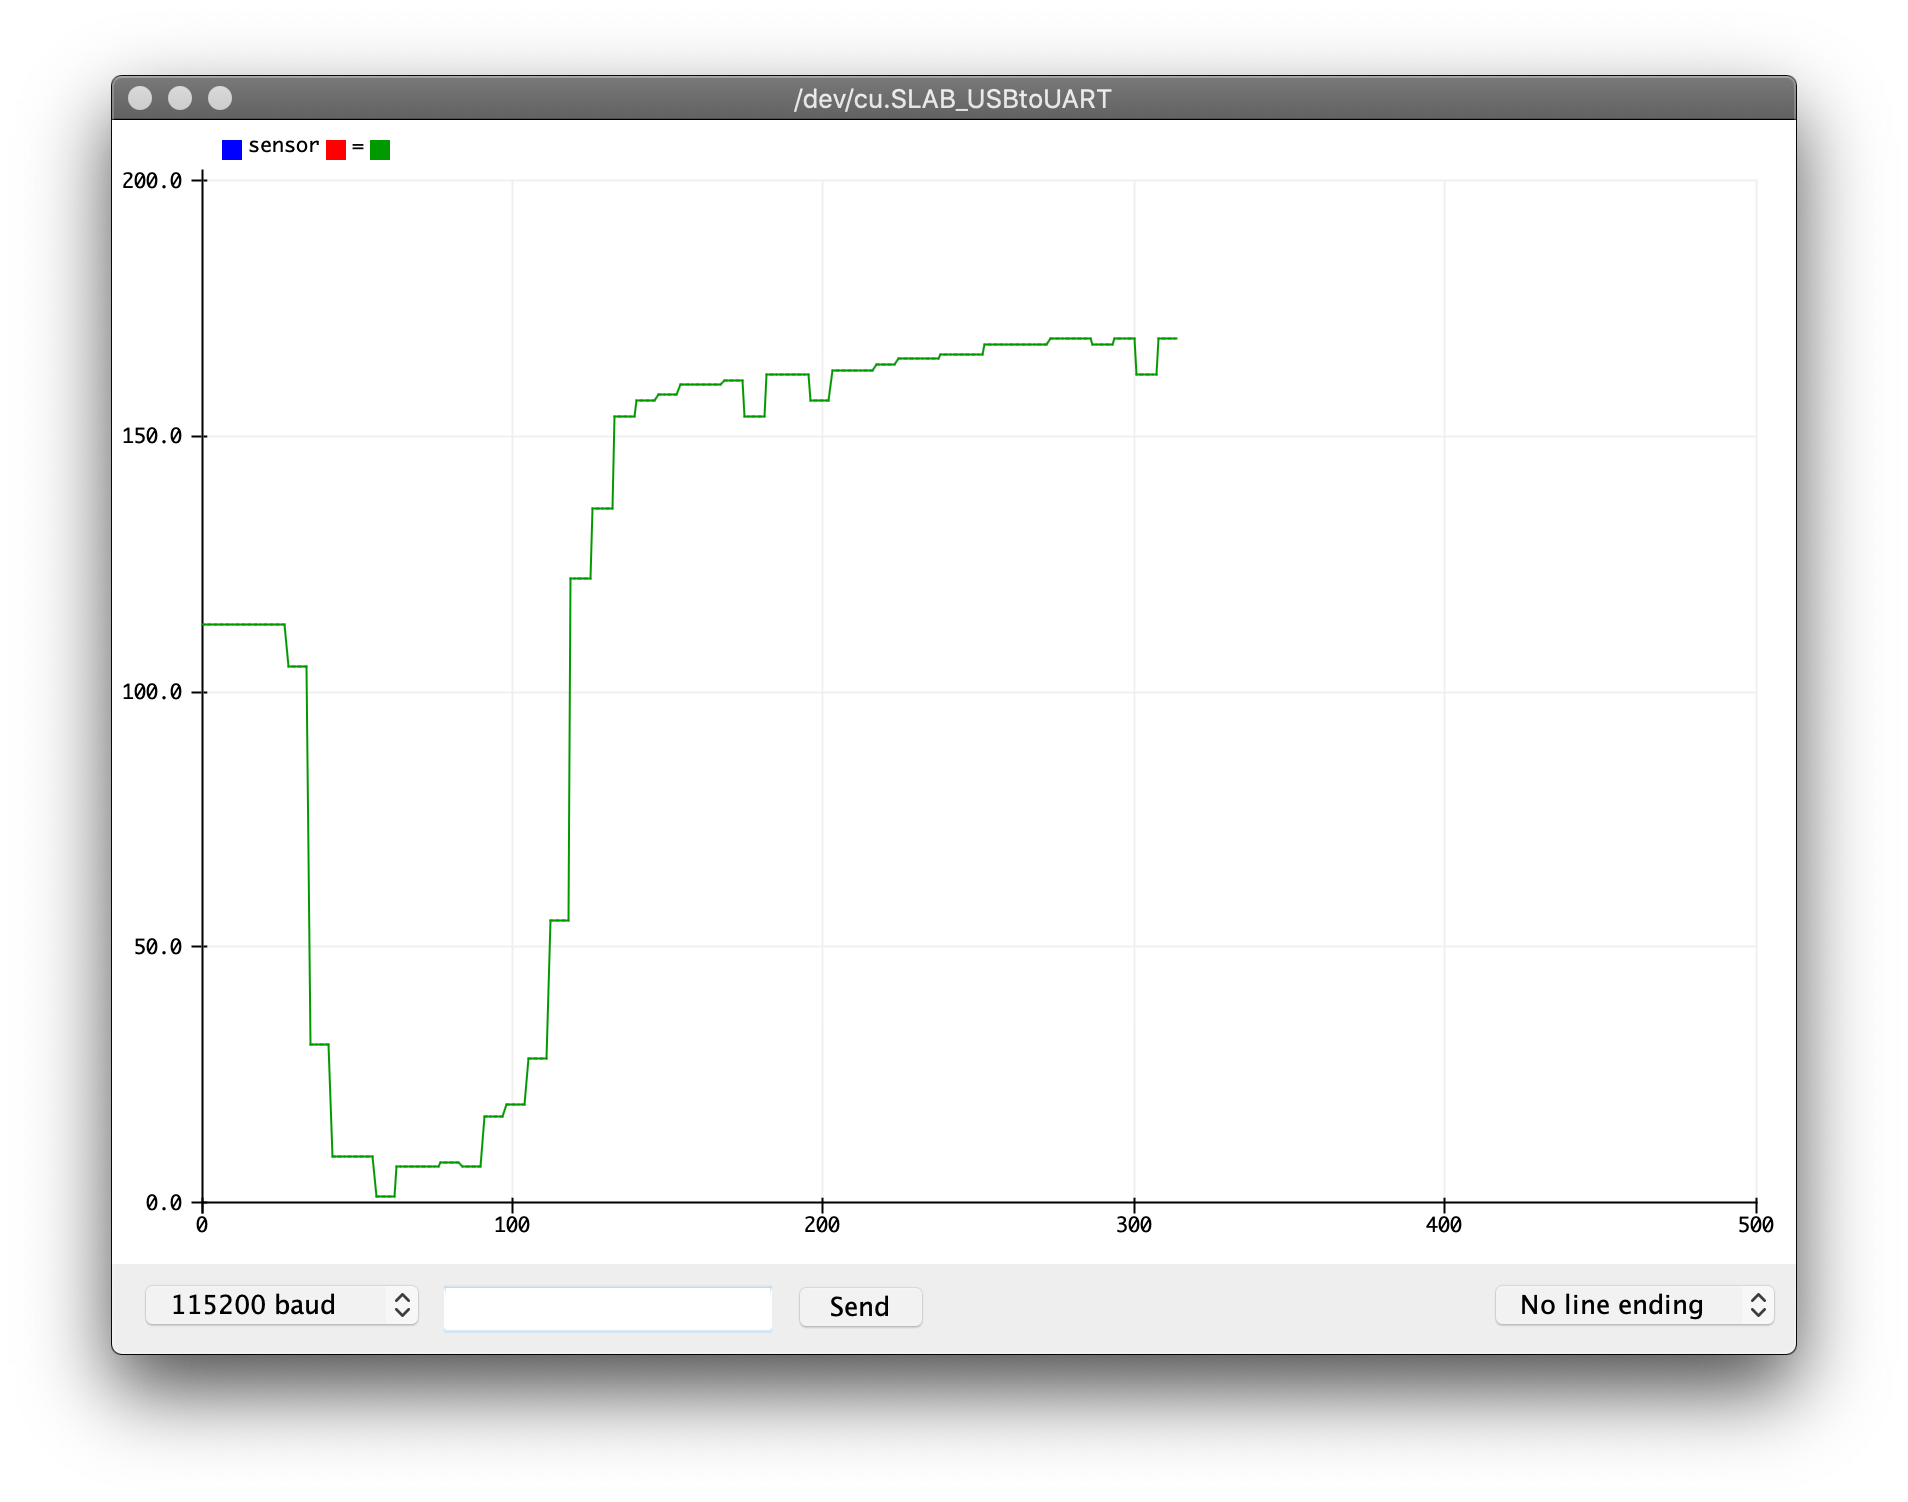
Serial.print("sensor = " );
Serial.println(moisture_val);
delay(100);
}
If you run this script and open the Serial Plotter (the Serial Plotter is next to Serial Monitor in the Arduino>Tools menu) you should see data flowing. In the image below the sensor was in soil at the start, i lifted it out and then pushed it back into the soil. Can you think how you might measure the min and max values? ie complete resistance and no resistance.
Next we will test the DHT22 sensor. Again a great library has already been written that makes this trivial. Go to Arduino>Tools>Manage Libraries and search for DHT - you should see an option from Adafruit. Install that library. You will then see some example code in Arduino>Files>Examples under ‘DHT' or similar. A minimal program would be:
#include <DHT.h>
#include <DHT_U.h>
#define DHTTYPE DHT22   // DHT 22  (AM2302), AM2321

// DHT Sensor setup
uint8_t DHTPin = 12;        // on Pin 12 of the Huzzah
DHT dht(DHTPin, DHTTYPE);   // Initialize DHT sensor.

void setup() {
  // open serial connection
  Serial.begin(115200);
  delay(100);

  // start DHT sensor
  pinMode(DHTPin, INPUT);
  dht.begin();
}

void loop() {
  Serial.print("Temp:");
  Serial.println(dht.readTemperature()); // Gets the values of the temperature
  Serial.print("Hum:");
  Serial.println(dht.readHumidity()); // Gets the values of the humidity
  delay(1000);
}
Next up we will combine all the component parts we have developed and create the final script that takes moisture and temperature/humidity readings and sends them to our MQTT server.
Optional Extension Activity
The complete code is at DHT22_MQTT with nails The write up below walks you through key elements of the code.
We include the libraries needed for the sketch and define the sensor variables
#include <ESP8266WiFi.h>
#include <ESP8266WebServer.h>
#include <ezTime.h>
#include <PubSubClient.h>
#include <DHT.h>
#include <DHT_U.h>

#define DHTTYPE DHT22   // DHT 22  (AM2302), AM2321

// Sensors - DHT22 and Nails
uint8_t DHTPin = 12;        // on Pin 2 of the Huzzah
uint8_t soilPin = 0;      // ADC or A0 pin on Huzzah
float Temperature;
float Humidity;
int Moisture = 1; // initial value just in case web page is loaded before readMoisture called
int sensorVCC = 13;
int blueLED = 2;
DHT dht(DHTPin, DHTTYPE);   // Initialize DHT sensor.
We also declare variables for setting up Wifi and MQTT connections
// Wifi and MQTT
#include "arduino_secrets.h"
/*
**** please enter your sensitive data in the Secret tab/arduino_secrets.h
**** using format below

#define SECRET_SSID "ssid name"
#define SECRET_PASS "ssid password"
#define SECRET_MQTTUSER "user name - eg student"
#define SECRET_MQTTPASS "password";
 */

const char* ssid     = SECRET_SSID;
const char* password = SECRET_PASS;
const char* mqttuser = SECRET_MQTTUSER;
const char* mqttpass = SECRET_MQTTPASS;

ESP8266WebServer server(80);
const char* mqtt_server = "enter mqtt server";
WiFiClient espClient;
PubSubClient client(espClient);
long lastMsg = 0;
char msg[50];
int value = 0;

// Date and time
Timezone GB;
In setup we setup LEDs, open a Serial connection for debugging, setup the pin for the DHT sensor, start the wifi and set up the MQTT server.
void setup() {
  // Set up LED to be controllable via broker
  // Initialize the BUILTIN_LED pin as an output
  // Turn the LED off by making the voltage HIGH
  pinMode(BUILTIN_LED, OUTPUT);
  digitalWrite(BUILTIN_LED, HIGH);

  // Set up the outputs to control the soil sensor
  // switch and the blue LED for status indicator
  pinMode(sensorVCC, OUTPUT);
  digitalWrite(sensorVCC, LOW);
  pinMode(blueLED, OUTPUT);
  digitalWrite(blueLED, HIGH);

  // open serial connection for debug info
  Serial.begin(115200);
  delay(100);

  // start DHT sensor
  pinMode(DHTPin, INPUT);
  dht.begin();

  // run initialisation functions
  startWifi();
  startWebserver();
  syncDate();

  // start MQTT server
  client.setServer(mqtt_server, 1884);
  client.setCallback(callback);

}
In the main loop we check the handler for the webserver to see if anyone is requesting a webpage. If we are at the start of a new minute we call the sensor functions, MQTT sender function and print some debug code. At the end of the loop we check the MQTT client to see if any messages have been received.
void loop() {
  // handler for receiving requests to webserver
  server.handleClient();

  if (minuteChanged()) {
    readMoisture();
    sendMQTT();
    Serial.println(GB.dateTime("H:i:s")); // UTC.dateTime("l, d-M-y H:i:s.v T")
  }

  client.loop();
}
The readMoisture function turns on the soil sensor (using the NPN BC547 as a digital switch) so that voltage is applied to the soil sensor and a resistance can be measured. The delays are to slow down the process a little to enable the current to stabilise. The LEDs are turned on and off to help debug when measurements are being taken. The commented out map function can be used to convert an analogRead value to a value between known limits e.g. 0-100. To do this you will need to work out what the upper limit on the map function is. Below it is shown at 320. On your nails / setup is could be larger or smaller. Remember the question in the previous step about min and max values?
void readMoisture(){

  // power the sensor
  digitalWrite(sensorVCC, HIGH);
  digitalWrite(blueLED, LOW);
  delay(100);
  // read the value from the sensor:
  Moisture = analogRead(soilPin);
  //Moisture = map(analogRead(soilPin), 0,320, 0, 100);    // note: if mapping work out max value by dipping in water
  //stop power
  digitalWrite(sensorVCC, LOW);
  digitalWrite(blueLED, HIGH);
  delay(100);
  Serial.print("Wet ");
  Serial.println(Moisture);   // read the value from the nails
}
The startWifi function starts the wifi!
void startWifi() {
  // We start by connecting to a WiFi network
  Serial.println();
  Serial.print("Connecting to ");
  Serial.println(ssid);
  WiFi.begin(ssid, password);

  // check to see if connected and wait until you are
  while (WiFi.status() != WL_CONNECTED) {
    delay(500);
    Serial.print(".");
  }
  Serial.println("");
  Serial.println("WiFi connected");
  Serial.print("IP address: ");
  Serial.println(WiFi.localIP());
}
The syncDate function sets the time on the device. Do you remember why?
void syncDate() {
  // get real date and time
  waitForSync();
  Serial.println("UTC: " + UTC.dateTime());
  GB.setLocation("Europe/London");
  Serial.println("London time: " + GB.dateTime());
}
The startWebserver function starts the webserver!
void startWebserver() {
  // when connected and IP address obtained start HTTP server
  server.on("/", handle_OnConnect);
  server.onNotFound(handle_NotFound);
  server.begin();
  Serial.println("HTTP server started");
}
The sendMQTT function tries to reconnect to the MQTT broker if it isn't already connected, checks to see if there are any messages inbound and then reads sensors and publishes the readings. You will notice the sensor values are being stored in a msg character array (char) using the snprintf function. The MQTT library requires this char array. For a more in depth look jump to this link for snprintf and this one for info on the MQTT API. Can you think why we are taking new readings for Temperature and Humidity but not for Moisture?
void sendMQTT() {

  if (!client.connected()) {
    reconnect();
  }
  client.loop();

  Temperature = dht.readTemperature(); // Gets the values of the temperature
  snprintf (msg, 50, "%.1f", Temperature);
  Serial.print("Publish message for t: ");
  Serial.println(msg);
  client.publish("student/CASA0014/plant/ucxxxxx/temperature", msg);

  Humidity = dht.readHumidity(); // Gets the values of the humidity
  snprintf (msg, 50, "%.0f", Humidity);
  Serial.print("Publish message for h: ");
  Serial.println(msg);
  client.publish("student/CASA0014/plant/ucxxxxx/humidity", msg);

  //Moisture = analogRead(soilPin);   // moisture read by readMoisture function
  snprintf (msg, 50, "%.0i", Moisture);
  Serial.print("Publish message for m: ");
  Serial.println(msg);
  client.publish("student/CASA0014/plant/ucxxxxx/moisture", msg);

}
The callback function executes code when a message is received from the MQTT server for any topics that we are subscribed to. Can you remember where in the code we subscribed to inbound topics?
void callback(char* topic, byte* payload, unsigned int length) {
  Serial.print("Message arrived [");
  Serial.print(topic);
  Serial.print("] ");
  for (int i = 0; i < length; i++) {
    Serial.print((char)payload[i]);
  }
  Serial.println();

  // Switch on the LED if an 1 was received as first character
  if ((char)payload[0] == '1') {
    digitalWrite(BUILTIN_LED, LOW);   // Turn the LED on (Note that LOW is the voltage level
    // but actually the LED is on; this is because it is active low on the ESP-01)
  } else {
    digitalWrite(BUILTIN_LED, HIGH);  // Turn the LED off by making the voltage HIGH
  }

}
The reconnect function creates a connection to the MQTT server and defines any topics we subscribe to.
void reconnect() {
  // Loop until we're reconnected
  while (!client.connected()) {
    Serial.print("Attempting MQTT connection...");
    // Create a random client ID
    String clientId = "ESP8266Client-";
    clientId += String(random(0xffff), HEX);

    // Attempt to connect with clientID, username and password
    if (client.connect(clientId.c_str(), mqttuser, mqttpass)) {
      Serial.println("connected");
      // ... and resubscribe
      client.subscribe("student/CASA0014/plant/ucxxxxx/inTopic");
    } else {
      Serial.print("failed, rc=");
      Serial.print(client.state());
      Serial.println(" try again in 5 seconds");
      // Wait 5 seconds before retrying
      delay(5000);
    }
  }
}
The final three functions handle_OnConnect, handle_NotFound and SendHTML are all associated with the webserver. The latter is the web page sent when the browsing to the IP address of the Huzzah.
void handle_OnConnect() {
  Temperature = dht.readTemperature(); // Gets the values of the temperature
  Humidity = dht.readHumidity(); // Gets the values of the humidity
  server.send(200, "text/html", SendHTML(Temperature, Humidity, Moisture));
}

void handle_NotFound() {
  server.send(404, "text/plain", "Not found");
}

String SendHTML(float Temperaturestat, float Humiditystat, int Moisturestat) {
  String ptr = "<!DOCTYPE html> <html>\n";
  ptr += "<head><meta name=\"viewport\" content=\"width=device-width, initial-scale=1.0, user-scalable=no\">\n";
  ptr += "<title>ESP8266 DHT22 Report</title>\n";
  ptr += "<style>html { font-family: Helvetica; display: inline-block; margin: 0px auto; text-align: center;}\n";
  ptr += "body{margin-top: 50px;} h1 {color: #444444;margin: 50px auto 30px;}\n";
  ptr += "p {font-size: 24px;color: #444444;margin-bottom: 10px;}\n";
  ptr += "</style>\n";
  ptr += "</head>\n";
  ptr += "<body>\n";
  ptr += "<div id=\"webpage\">\n";
  ptr += "<h1>ESP8266 Huzzah DHT22 Report</h1>\n";

  ptr += "<p>Temperature: ";
  ptr += (int)Temperaturestat;
  ptr += " C</p>";
  ptr += "<p>Humidity: ";
  ptr += (int)Humiditystat;
  ptr += "%</p>";
  ptr += "<p>Moisture: ";
  ptr += Moisturestat;
  ptr += "</p>";
  ptr += "<p>Sampled on: ";
  ptr += GB.dateTime("l,");
  ptr += "<br>";
  ptr += GB.dateTime("d-M-y H:i:s T");
  ptr += "</p>";

  ptr += "</div>\n";
  ptr += "</body>\n";
  ptr += "</html>\n";
  return ptr;
}
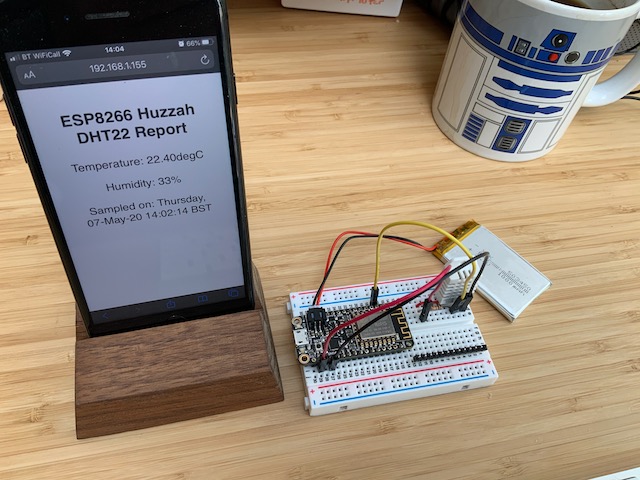
All being well, data should now be flowing from your Huzzah plant monitor to the MQTT webserver and visible locally by browsing to the IP address of the device. Next up we will look at the third part of the workshop - building a platform to store and display the data.
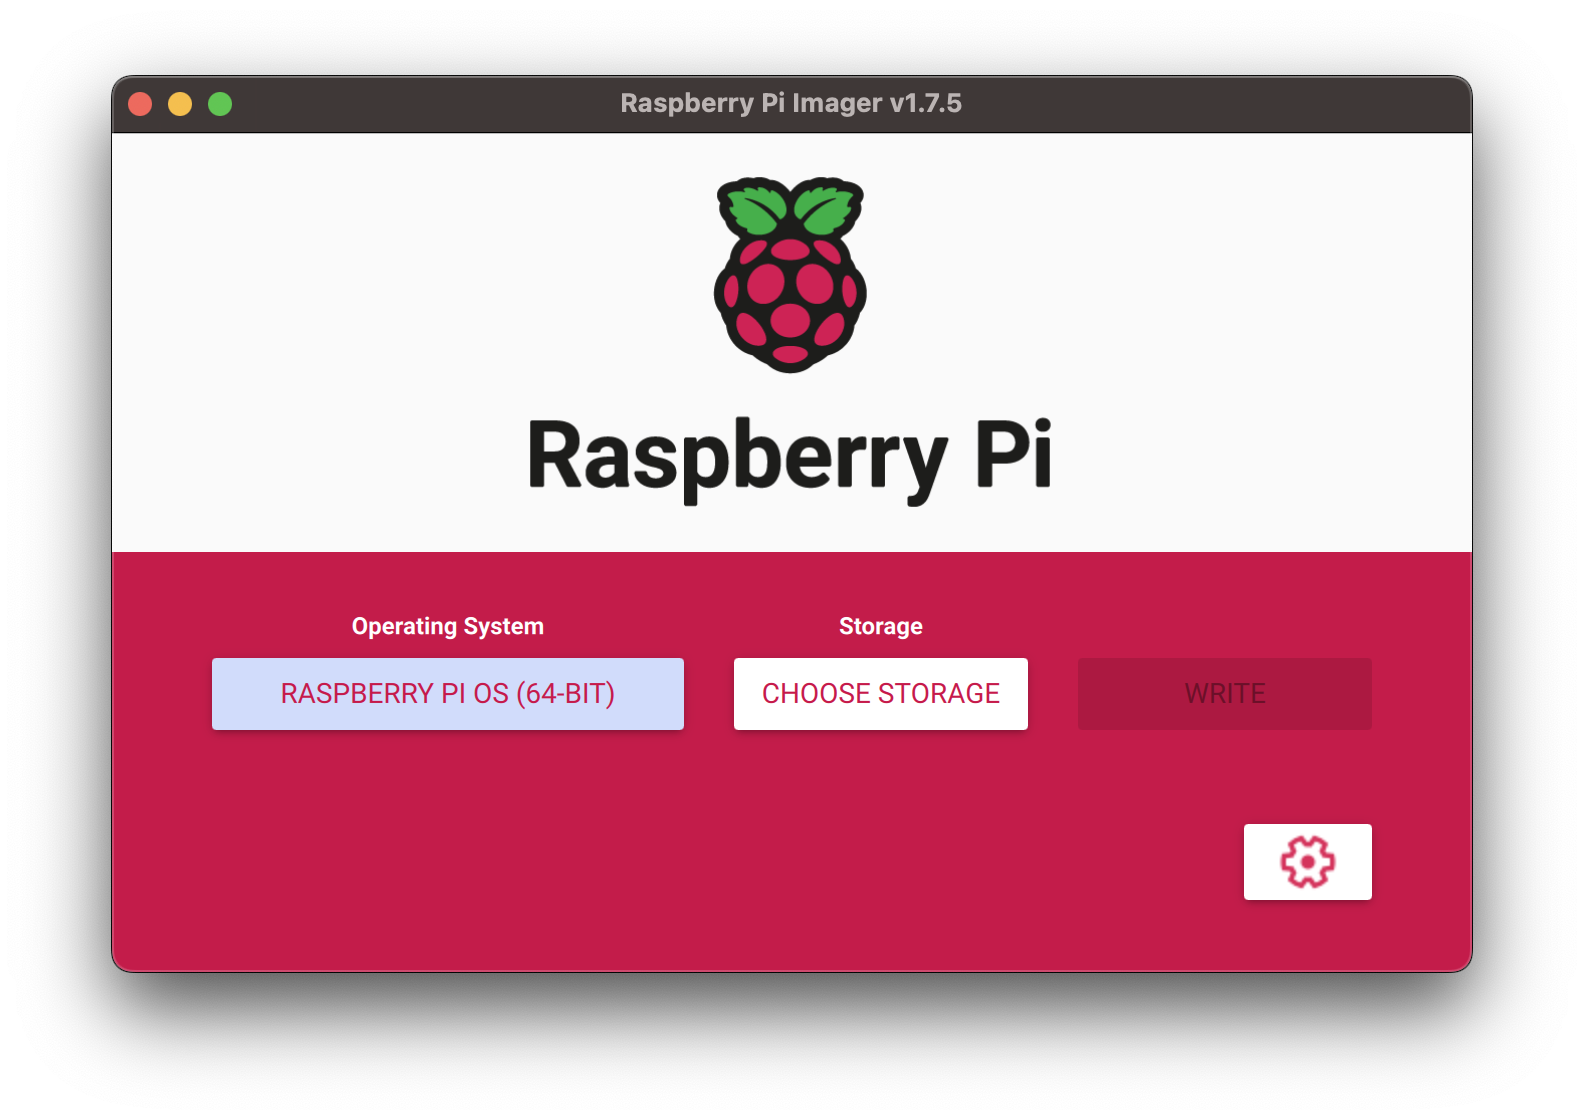
The starting point for this third stage is to set-up a Raspberry Pi to act as a datastore. I grabbed a RPi 4 and installed the latest 64bit version of Raspbian
The Raspberry Pi website has a really simple imager to setup a Pi and there are lots of tutorials on-line to get you started configuring network settings etc. This tutorial is useful for setting up a headless device when you can plug it into a network where you don't know which IP address will be assigned.
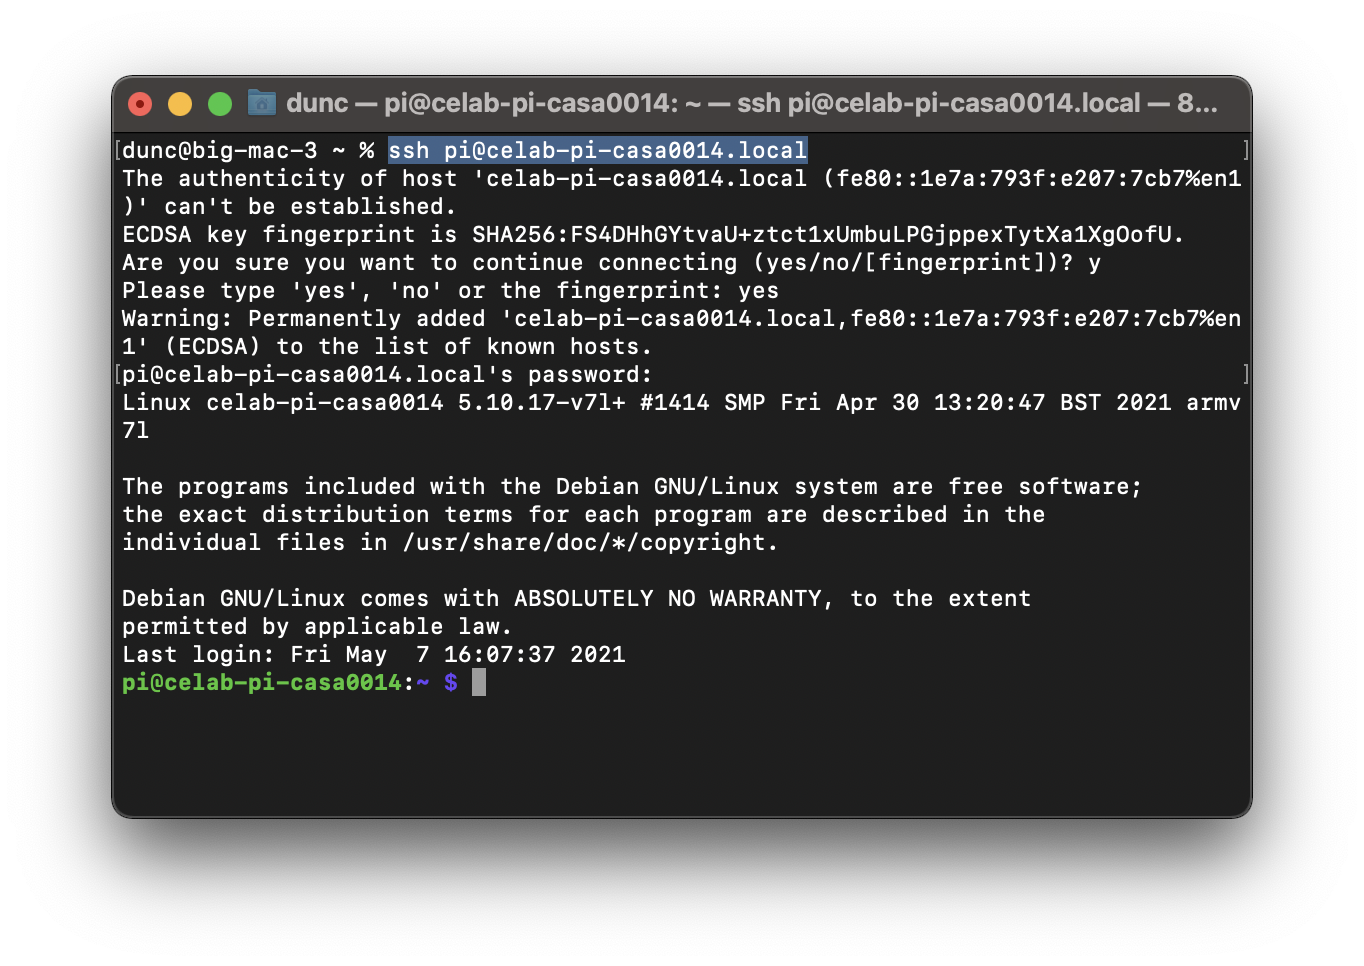
Once the card is flashed, insert it into the RPi and power it up. On your Mac / PC open up a Terminal / Putty session and log into the device using SSH. In my case i used:
ssh pi@staff-pi-casa0014.local
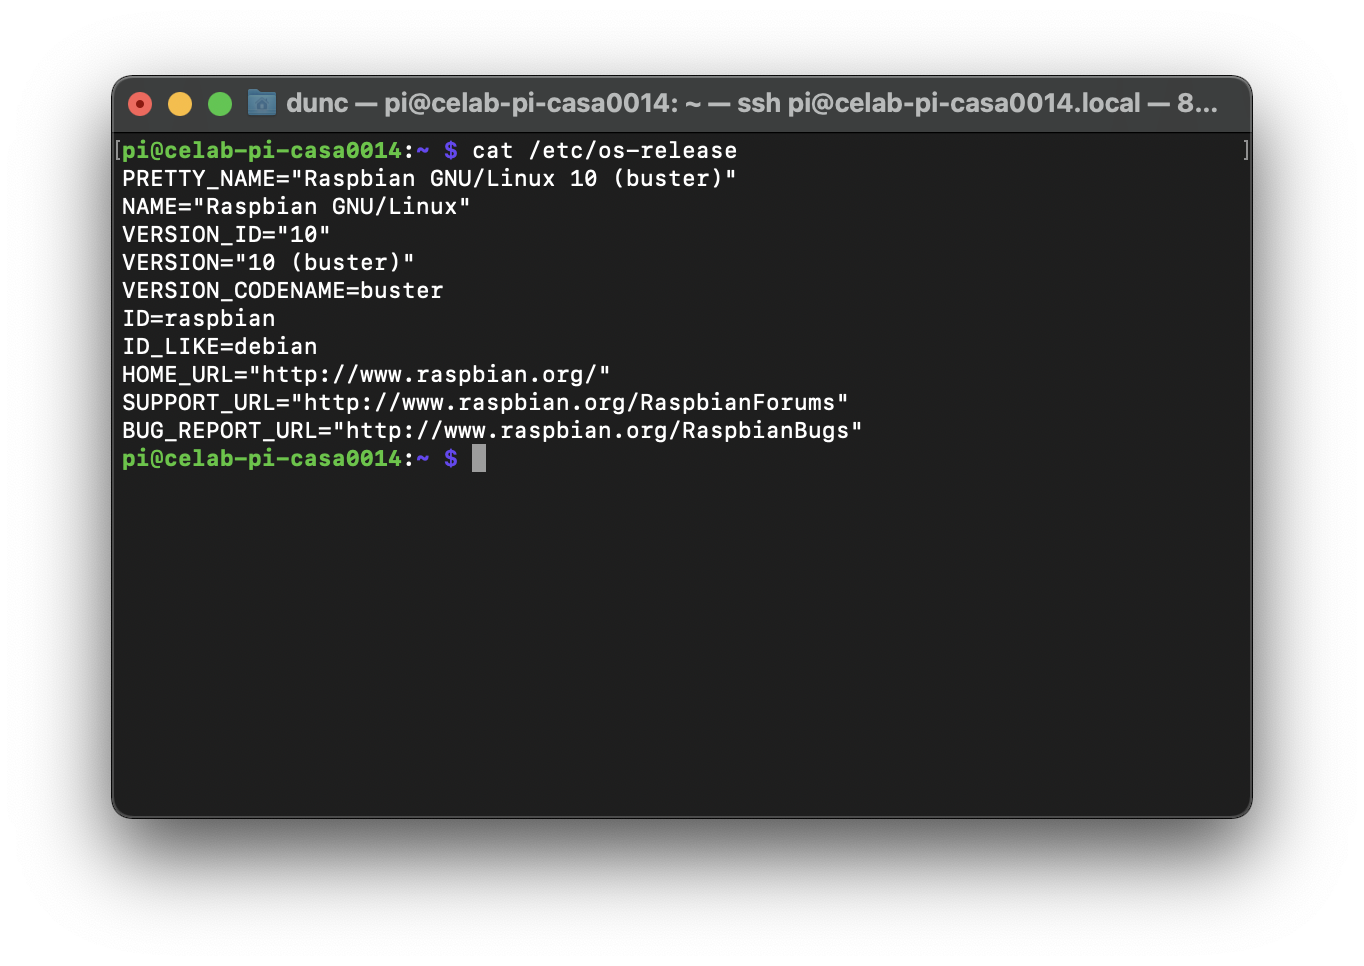
To check the OS of the device enter the following:
cat /etc/os-release
Which for me resulted in the following:
Finally do a quick update / upgrade to make sure all files are upto date and then reboot before moving on to installing the datastore.
sudo apt update
sudo apt upgrade -y
sudo reboot
Excellent, after a few minutes of updates, upgrades and a reboot you should have a shiny new RPi sitting alongside a bunch of others on the lab network. Log back into it through Terminal or Putty so that we can continue with the set-up.
Before we start installing the Influx, Telegraf and Grafana we will do a little housekeeping.
There will potentially be many RPi's on same network or in the lab so it will be useful to change the device hostname to something identifiable to you - hopefully you have done this already during the setup, for example I was using staff-pi-casa0014, the default is raspberrypi. If your hostname is still raspberrypi then change it by doing the following. If you have already named your device and are happy with the name then continue to the next page.
In the terminal enter the following command to use Nano to update your hostname.
sudo nano /etc/hostname
And repeat for hosts file:
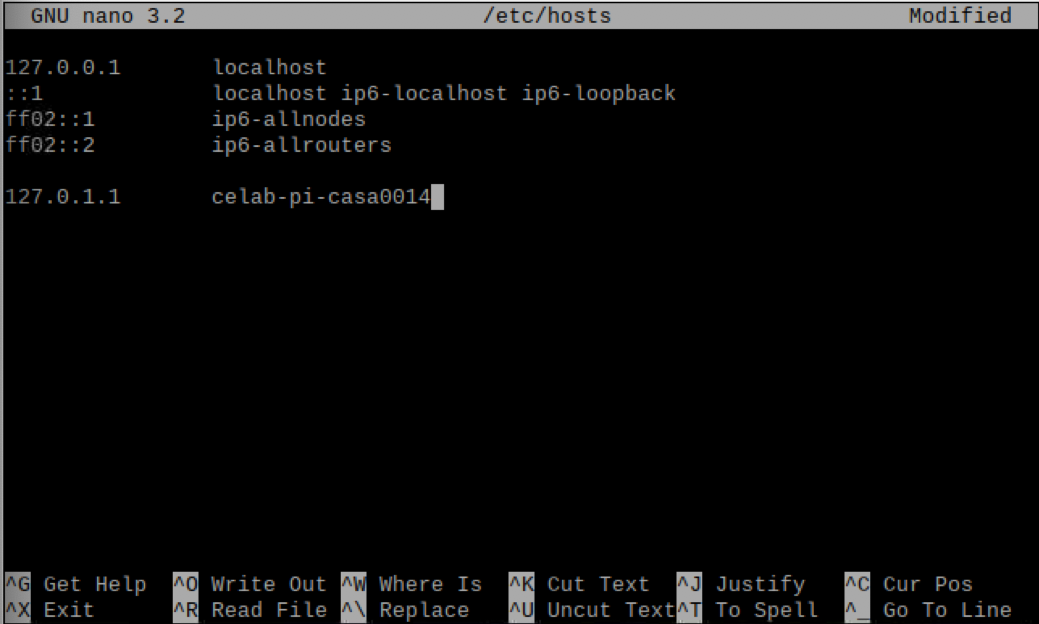
sudo nano /etc/hosts
In the hosts file you need to edit the entry against 127.0.0.1 as per image below.
Once done, run a reboot for good measure.
sudo reboot
InfluxDB downloads are available here. You can ignore the cloud sign up or join the free tier - your choice. Cancel the cloud signup pop up. We will use v2 (hence the requirement for a 64bit OS). You should see information similar to below for the downloads - but we will install from the command line on the RPi. We will use the Ubuntu & Debian (Arm 64-bit) option. (Note: the notes below are based on the official influxdata website notes)
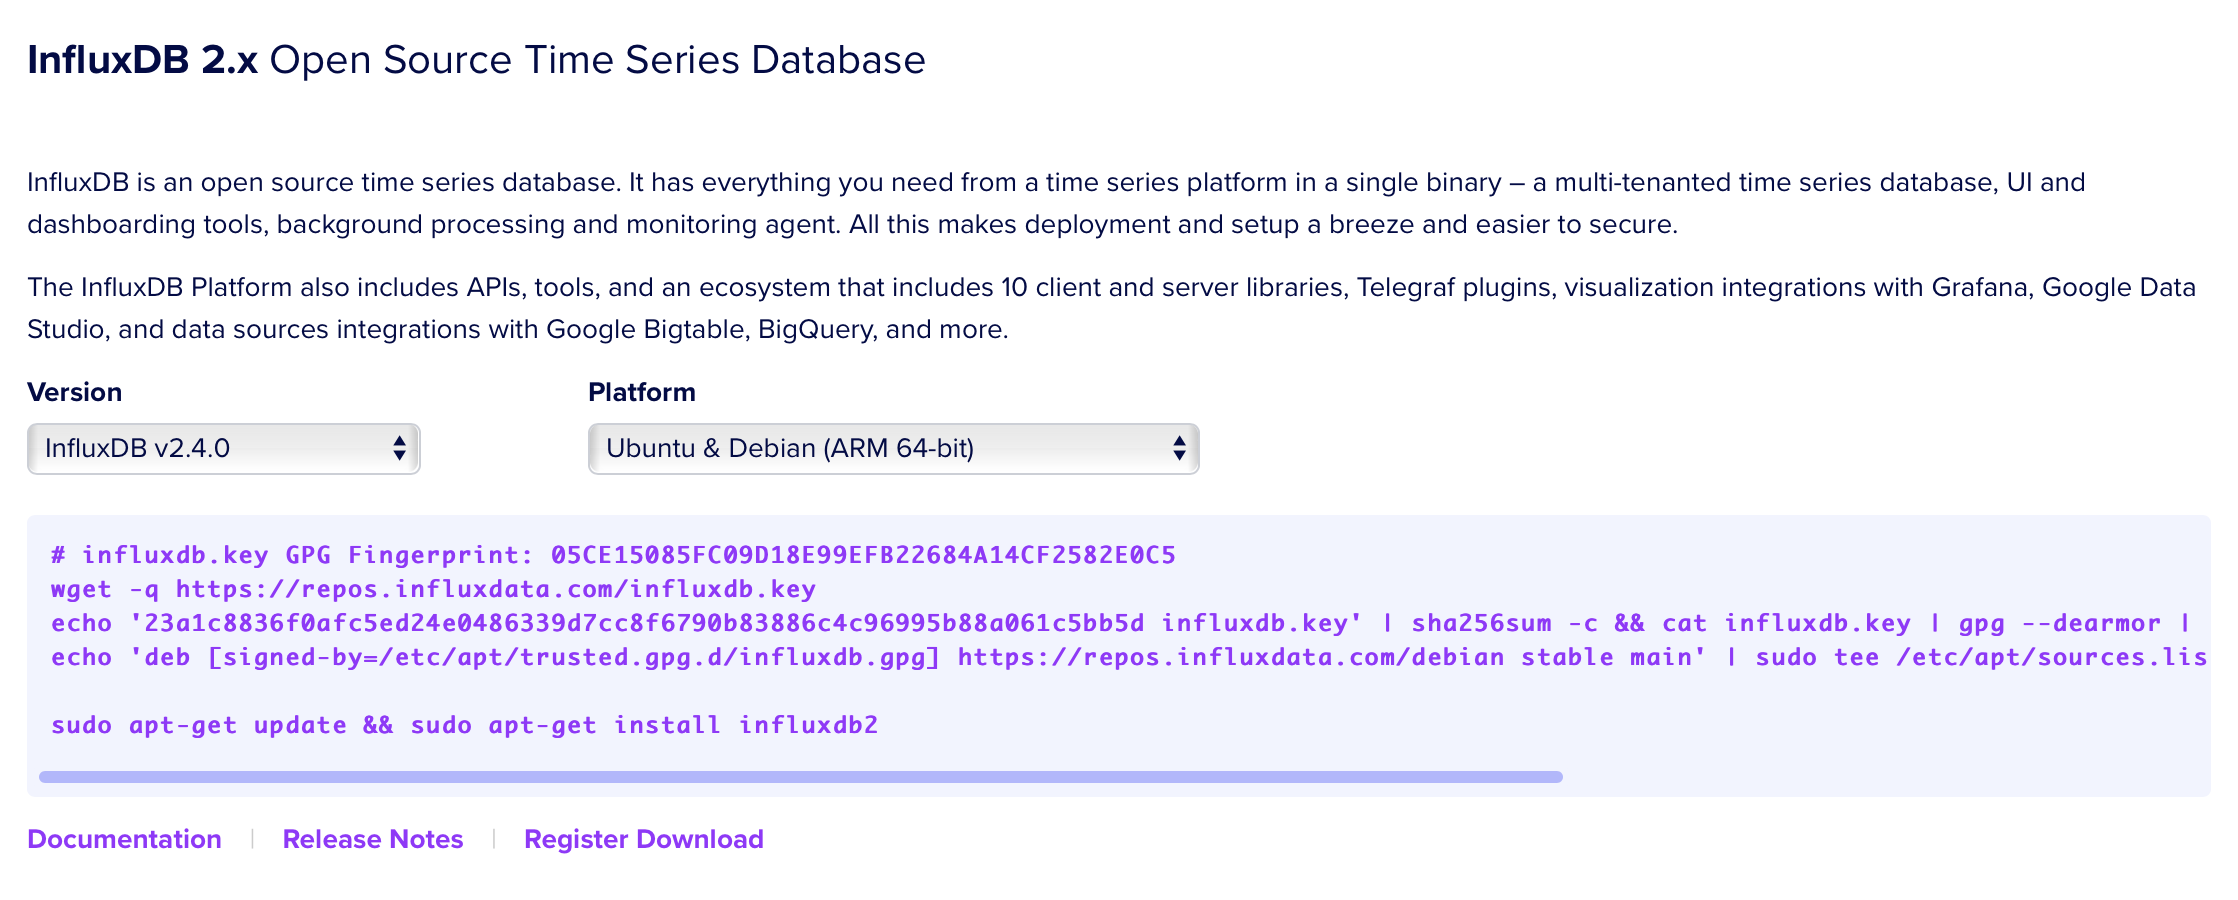
Install using the process below:
1] Add the InfluxDB key to ensure secure download and the repository to the sources list so that we can download it in the next step.
wget -q https://repos.influxdata.com/influxdata-archive_compat.key
echo '393e8779c89ac8d958f81f942f9ad7fb82a25e133faddaf92e15b16e6ac9ce4c influxdata-archive_compat.key' | sha256sum -c && cat influxdata-archive_compat.key | gpg --dearmor | sudo tee /etc/apt/trusted.gpg.d/influxdata-archive_compat.gpg > /dev/null
echo 'deb [signed-by=/etc/apt/trusted.gpg.d/influxdata-archive_compat.gpg] https://repos.influxdata.com/debian stable main' | sudo tee /etc/apt/sources.list.d/influxdata.list
2] With the repository added we now run another update to the package list
sudo apt-get update
3] Finally we install InfluxDB
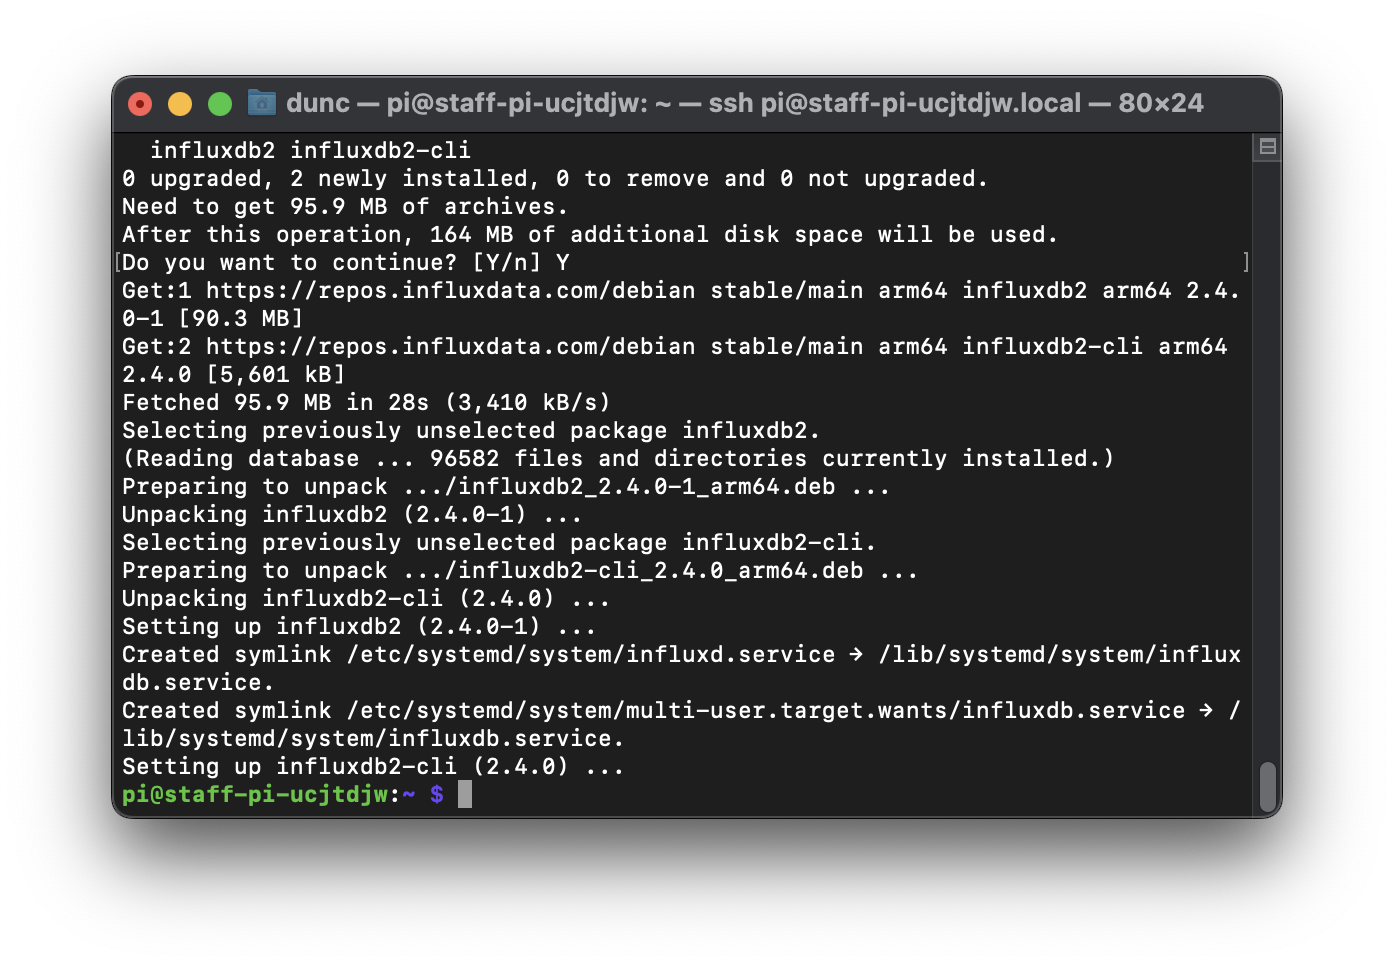
sudo apt-get install influxdb2 -y
This should result in an output similar to that in the image below:
Finally to get InfluxDB up and running at reboot we need to enable and start it within systemctl:
sudo systemctl unmask influxdb.service
sudo systemctl start influxdb
sudo systemctl enable influxdb.service
You can check if it is running ok with:
sudo systemctl status influxdb
Use CTRL C to break out of the systemctl command and get back to the terminal prompt.
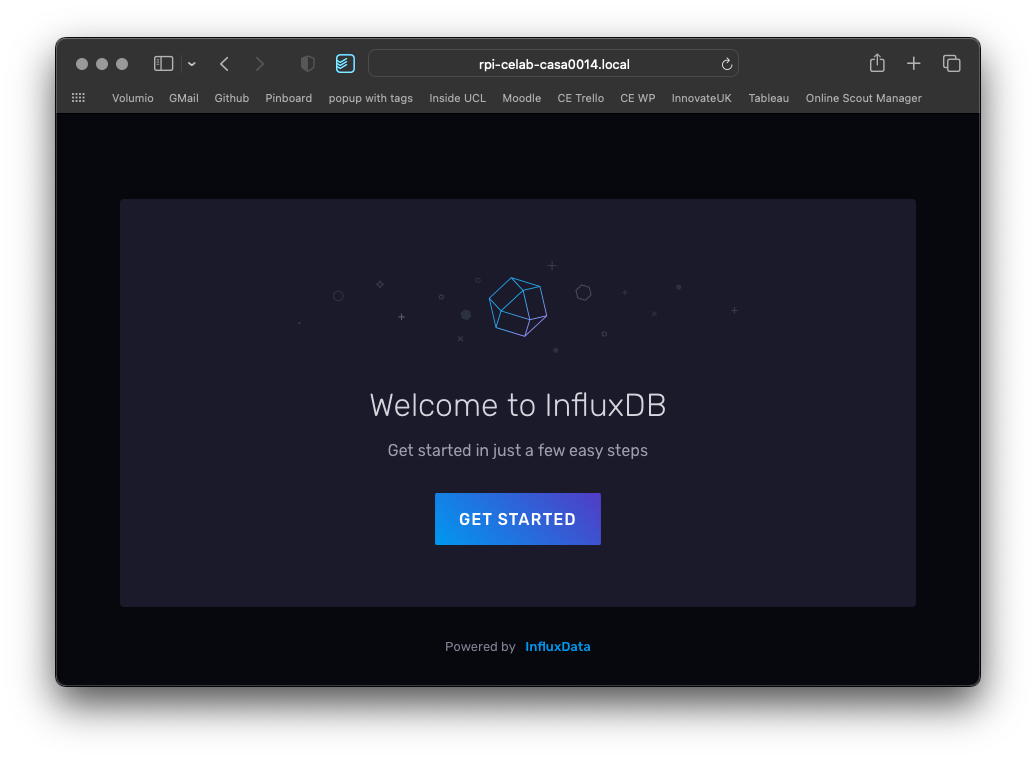
You should now be able to browse to your instance of InfluxDB running on your machine - in my case I browse to http://staff-pi-casa0014.celab:8086/
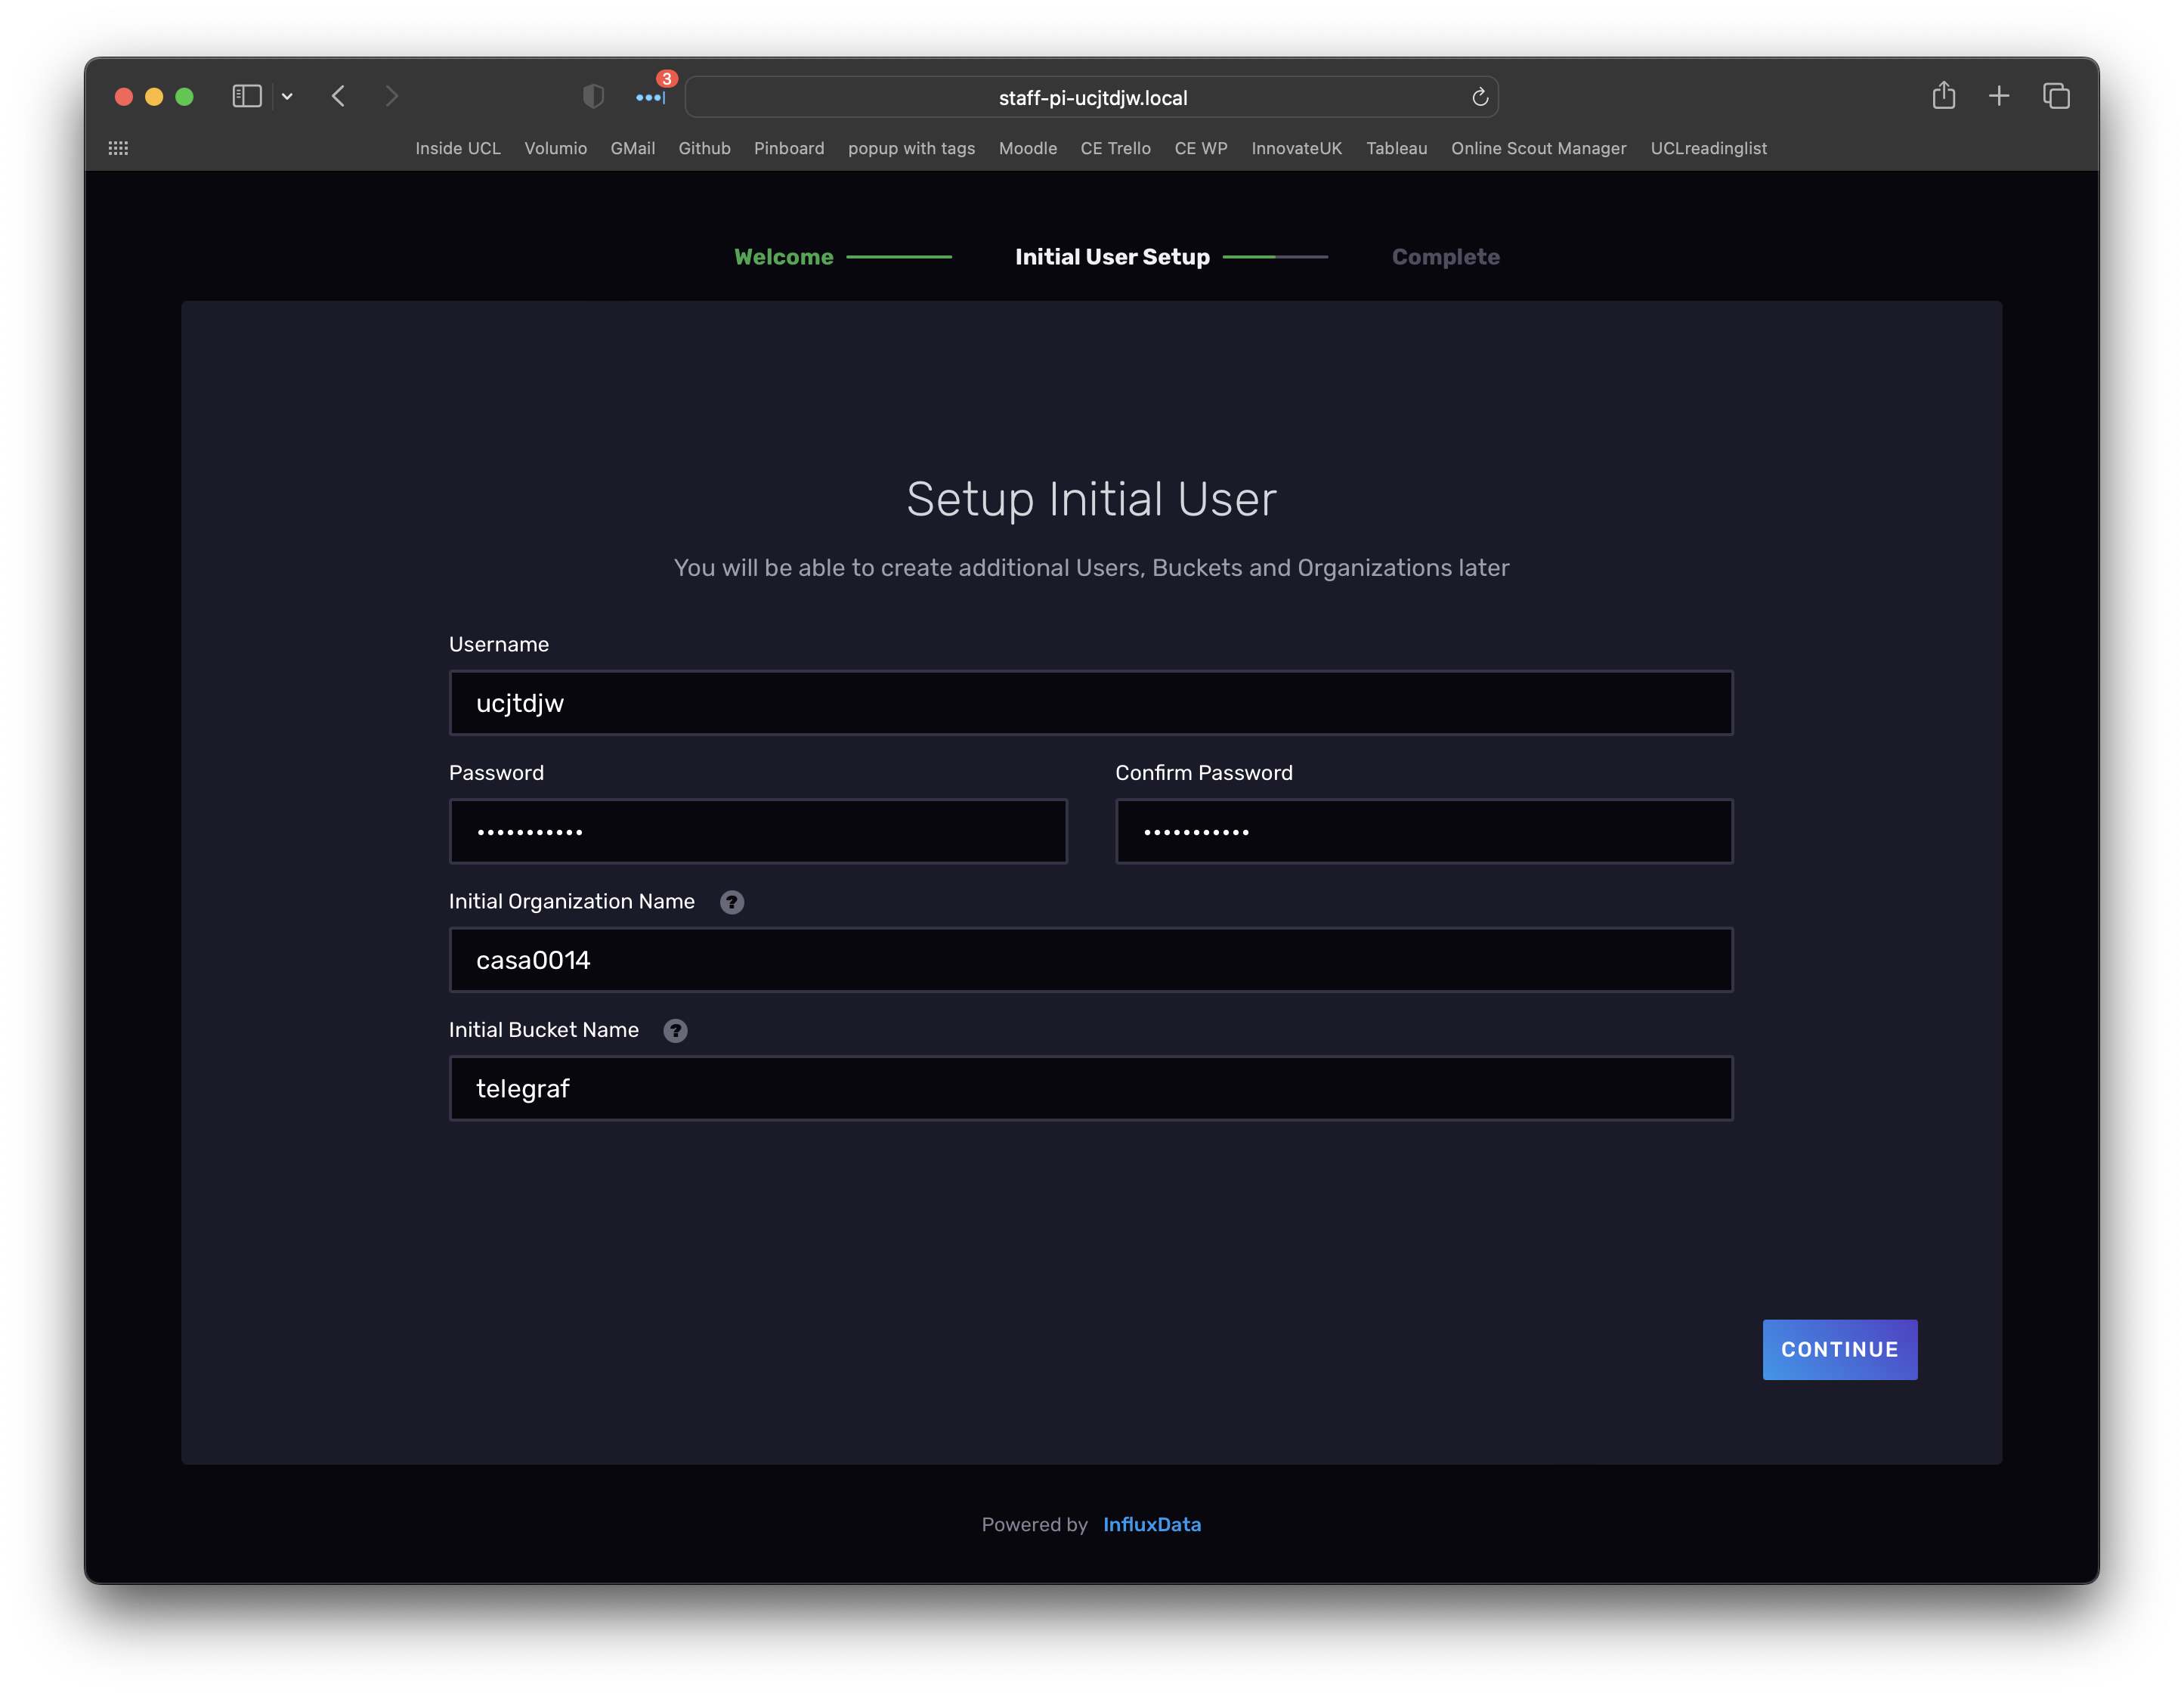
To get started fill out form - use your UCL username, remember the password you use, for organisation you can use casa0014 and for the initial bucket name use telegraf.
Click continue and then select quick start and you should see:
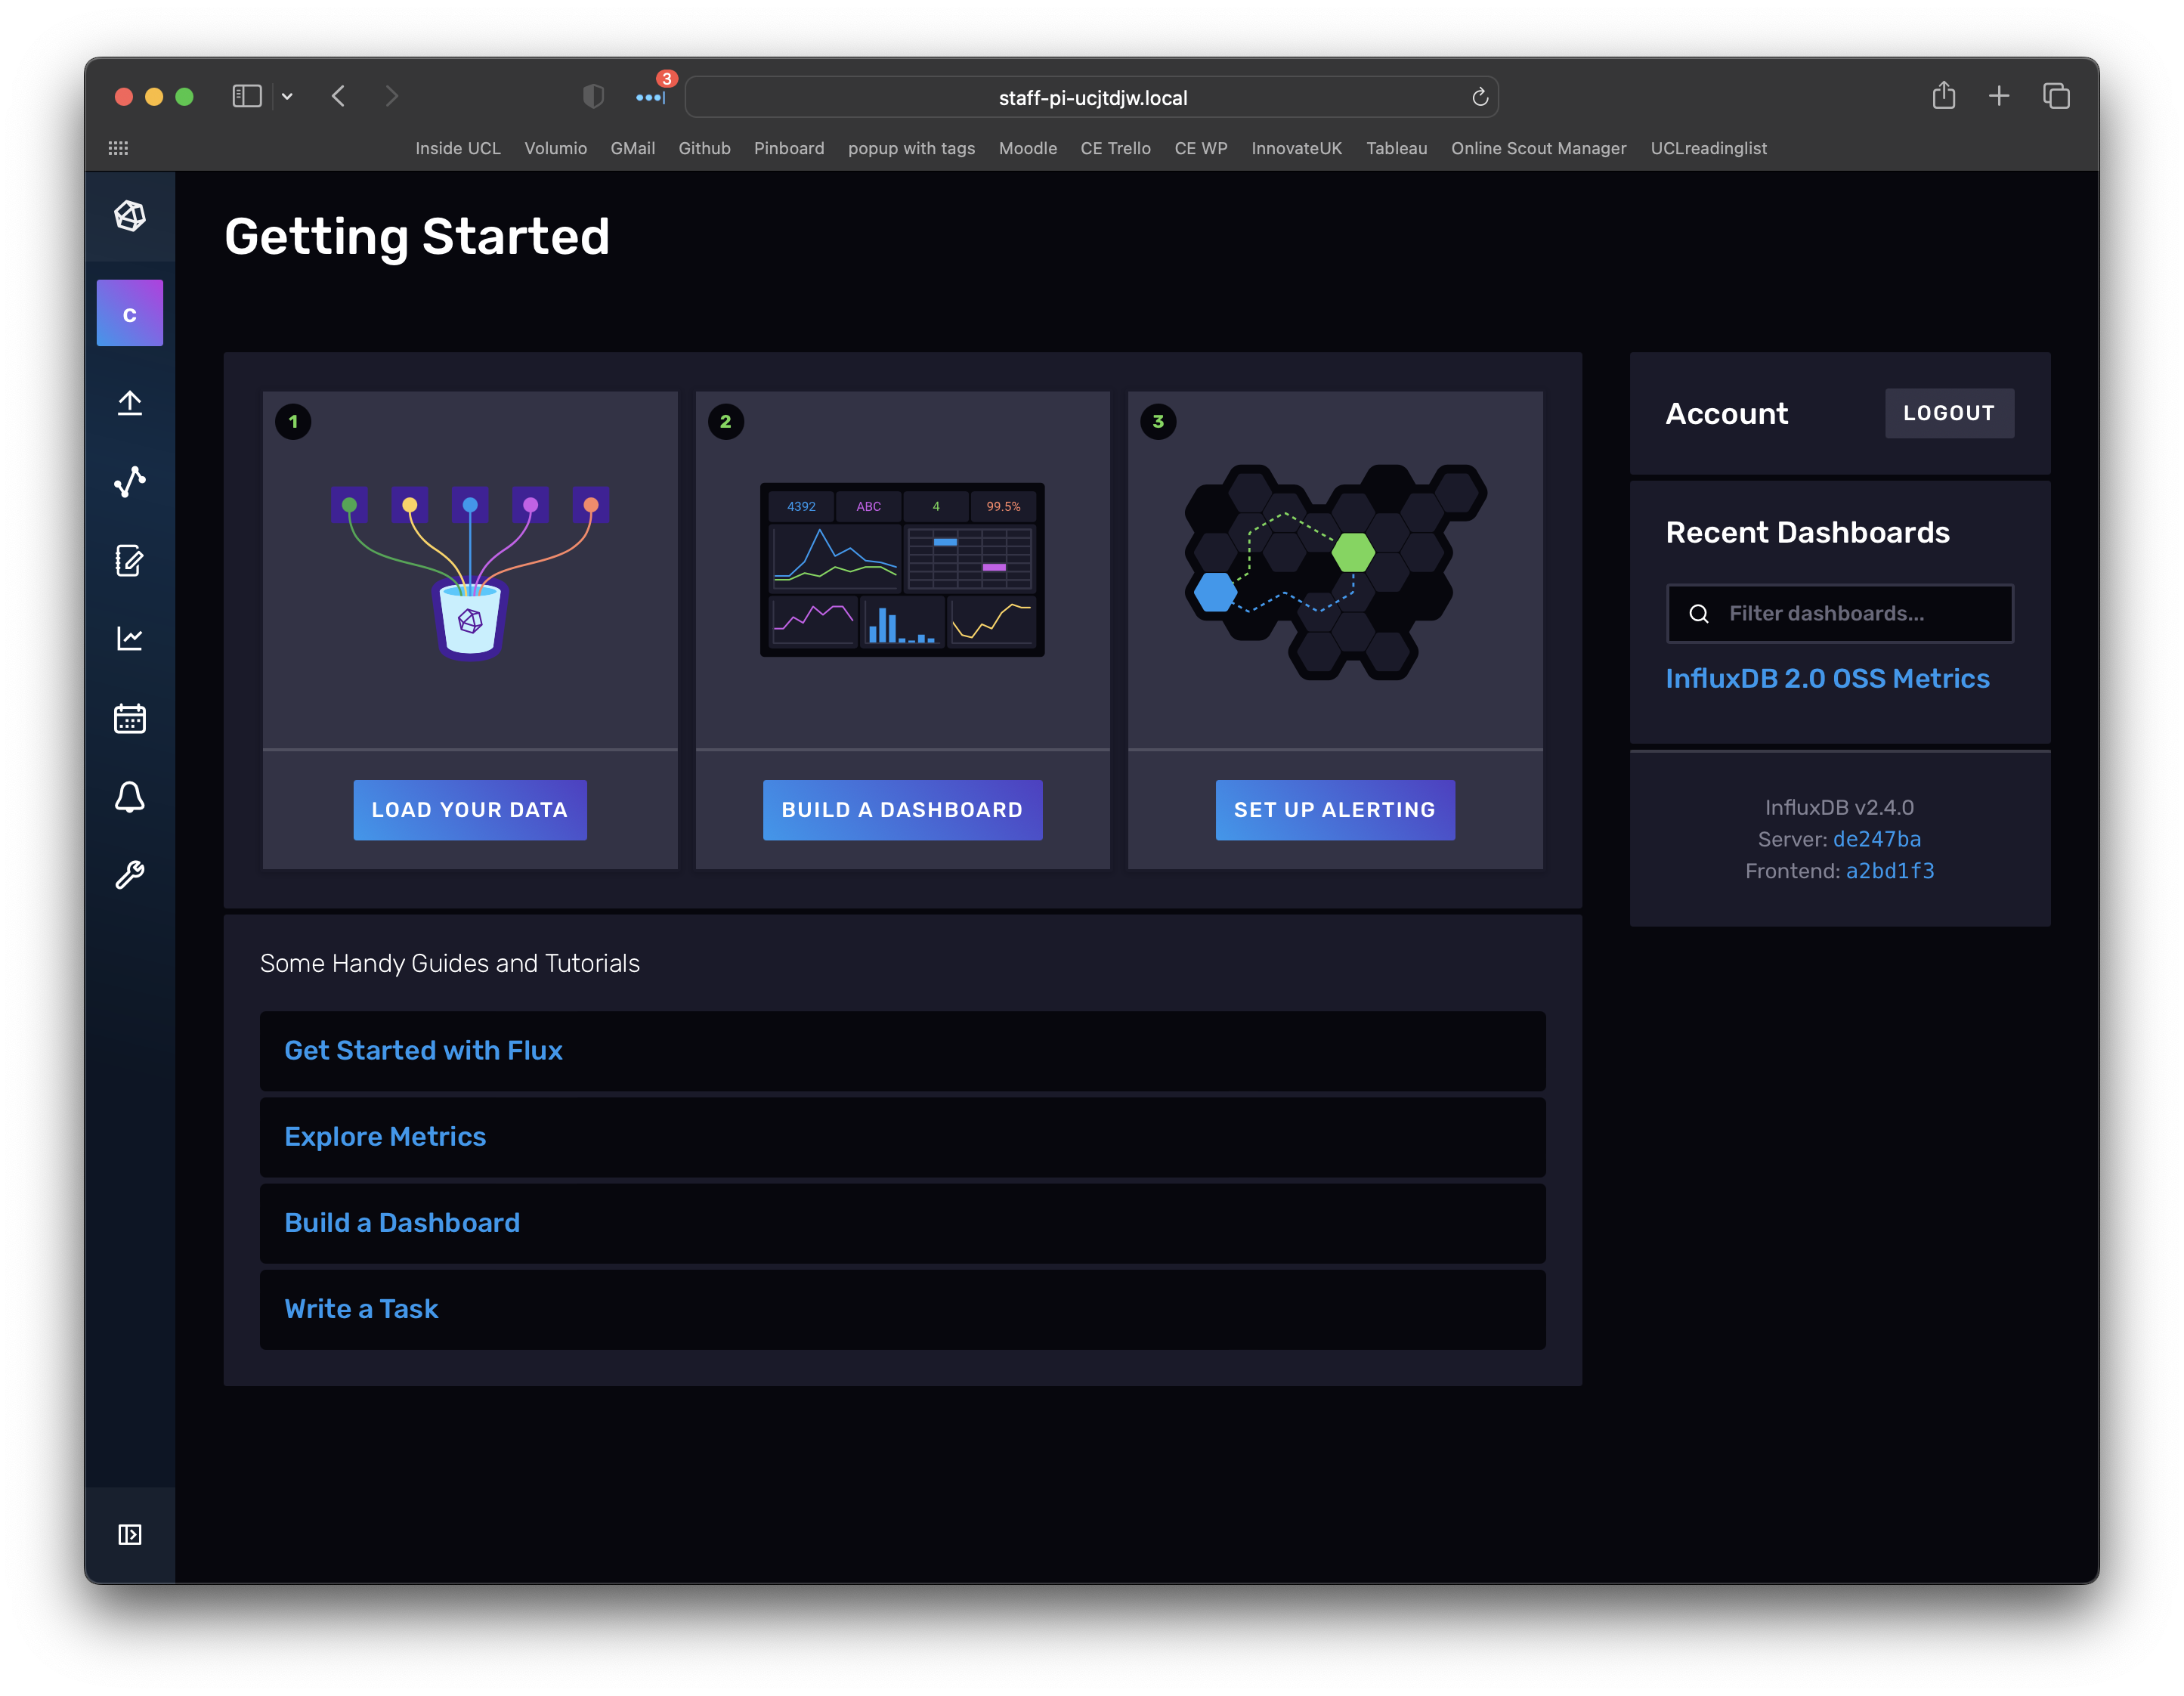
One of the great things about InfluxDB is that lots of folk are essentially building similar set-ups which mean that templates are starting to appear that do lots of the heavy lifting of setting up a system. To get started we will use a built in template for creating a datastore and dashboard for stats on the RPi system performance.
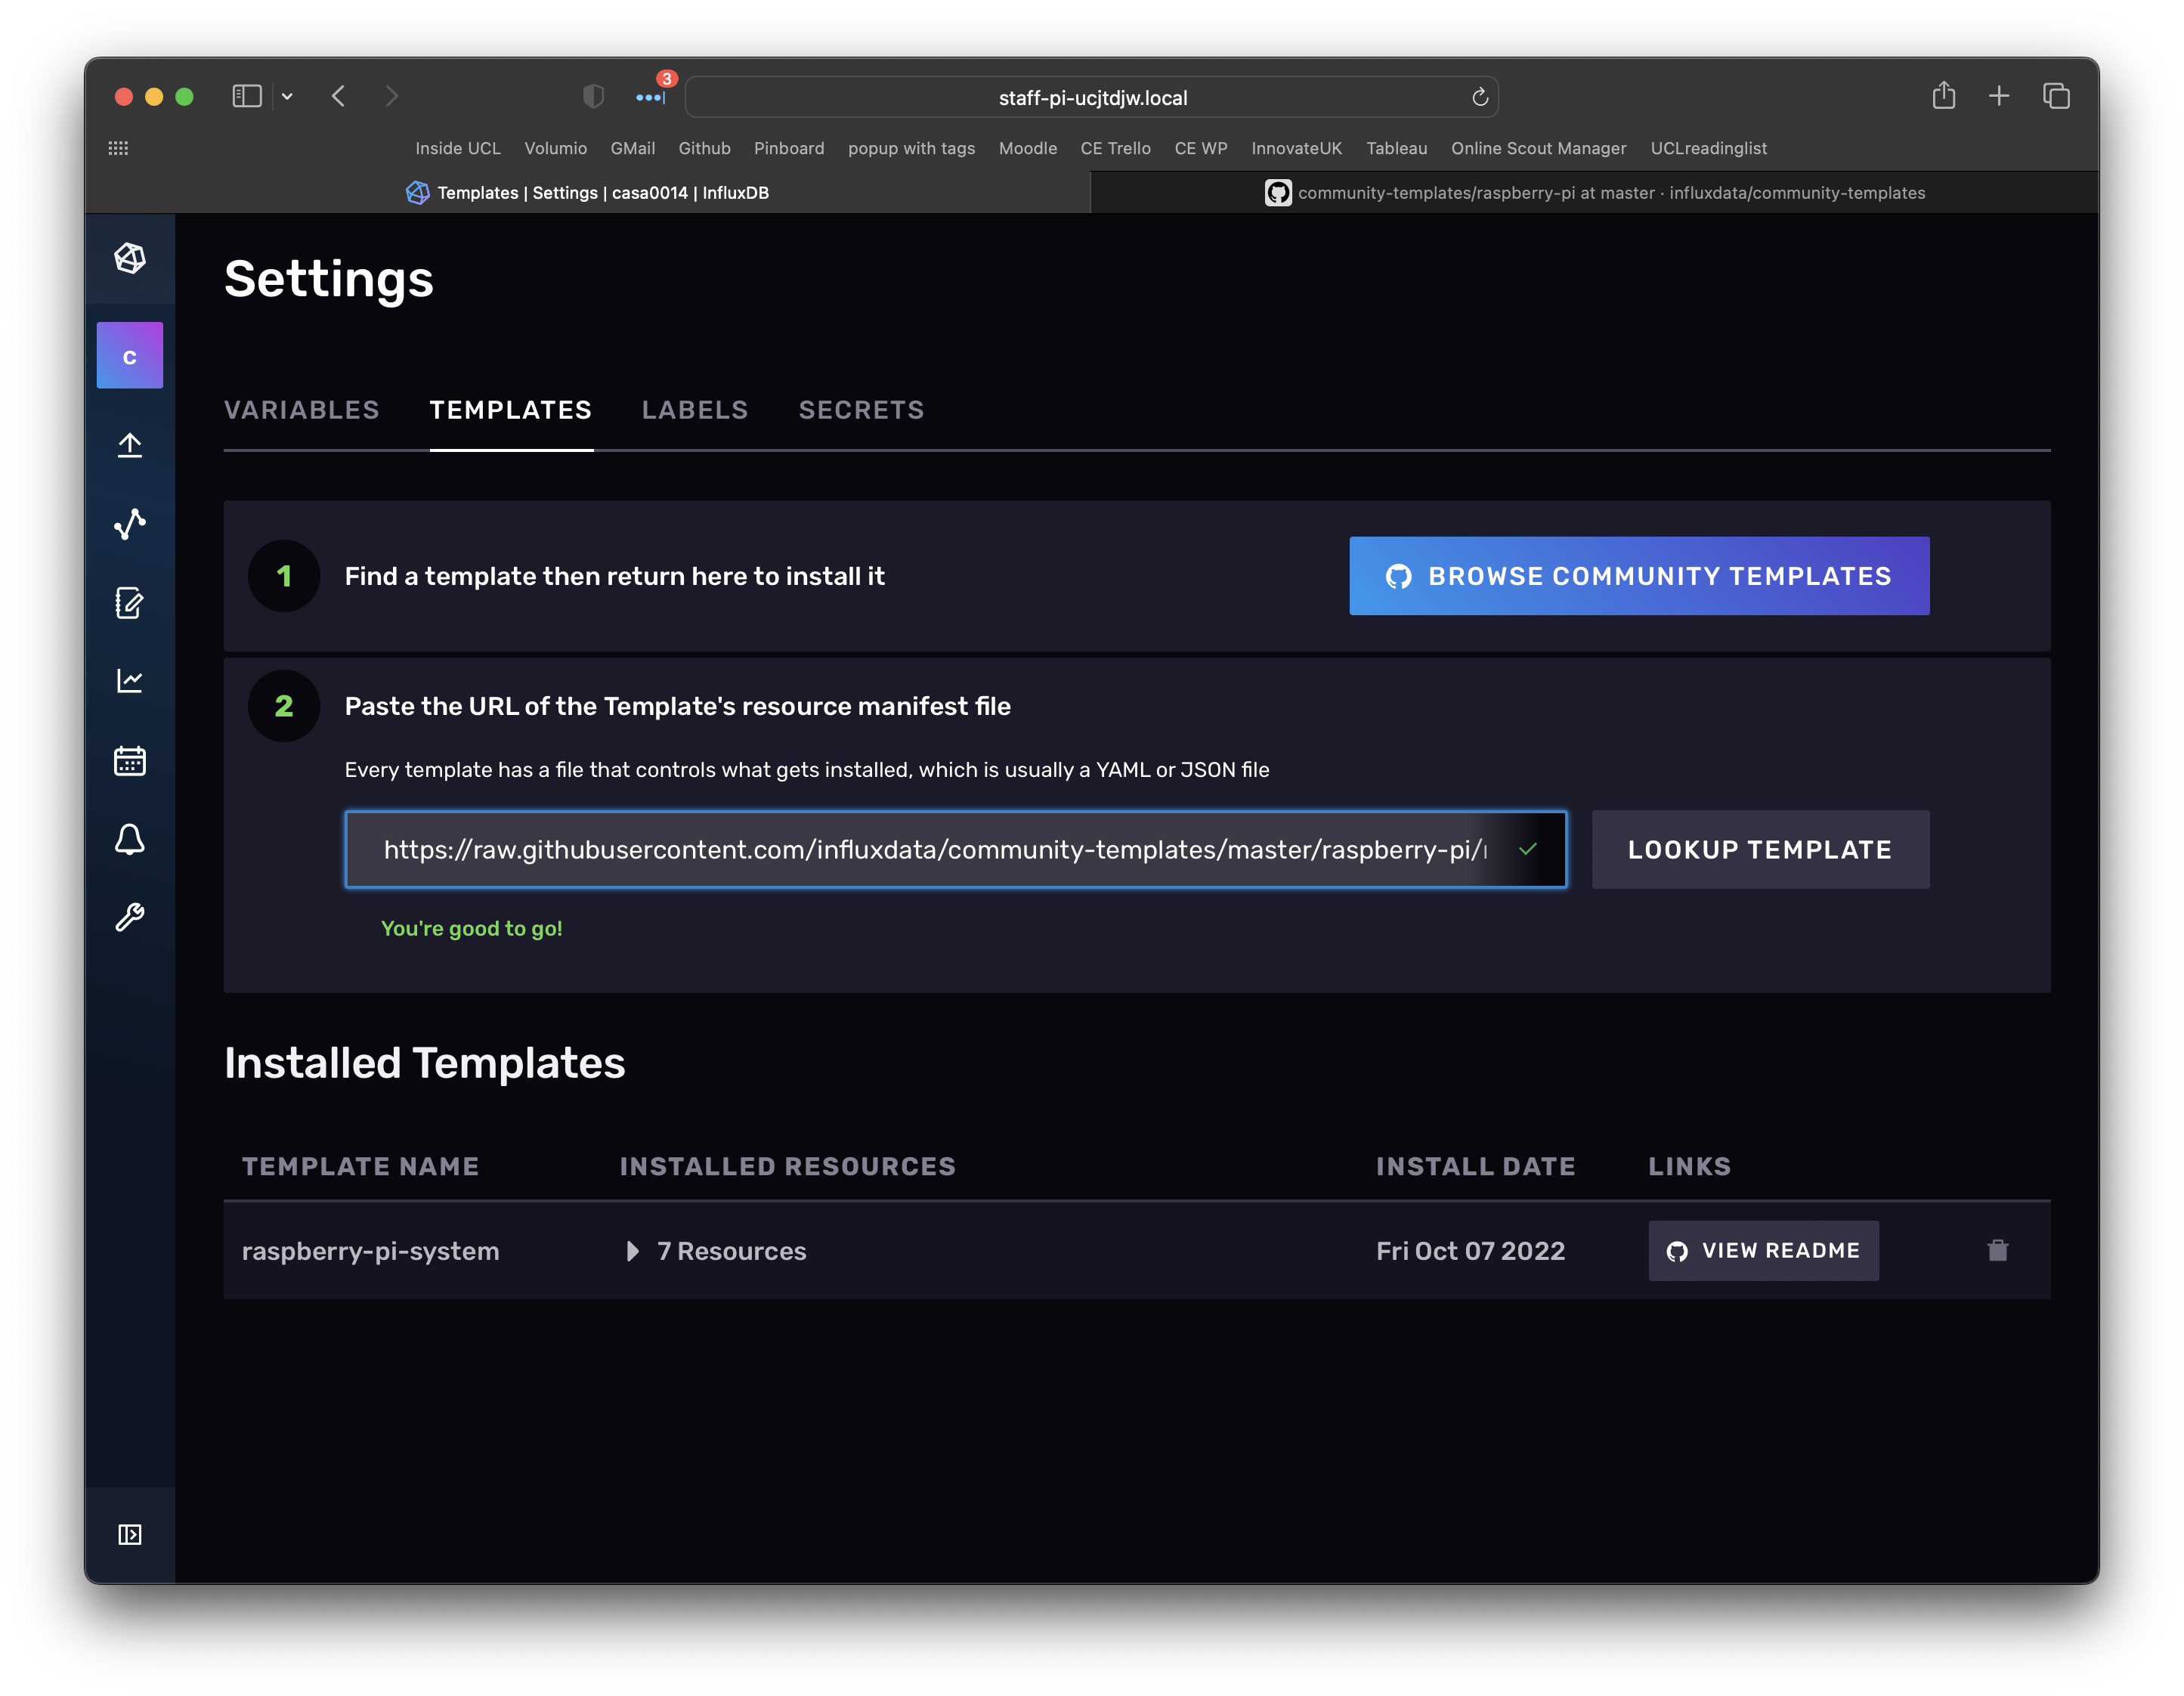
Open up the settings page ("cog" in left menu) and then select the Templates tab. From here you can look up a template for "Raspberry Pi". Note: we are just setting up the database to store data here - we have not started collecting data yet.
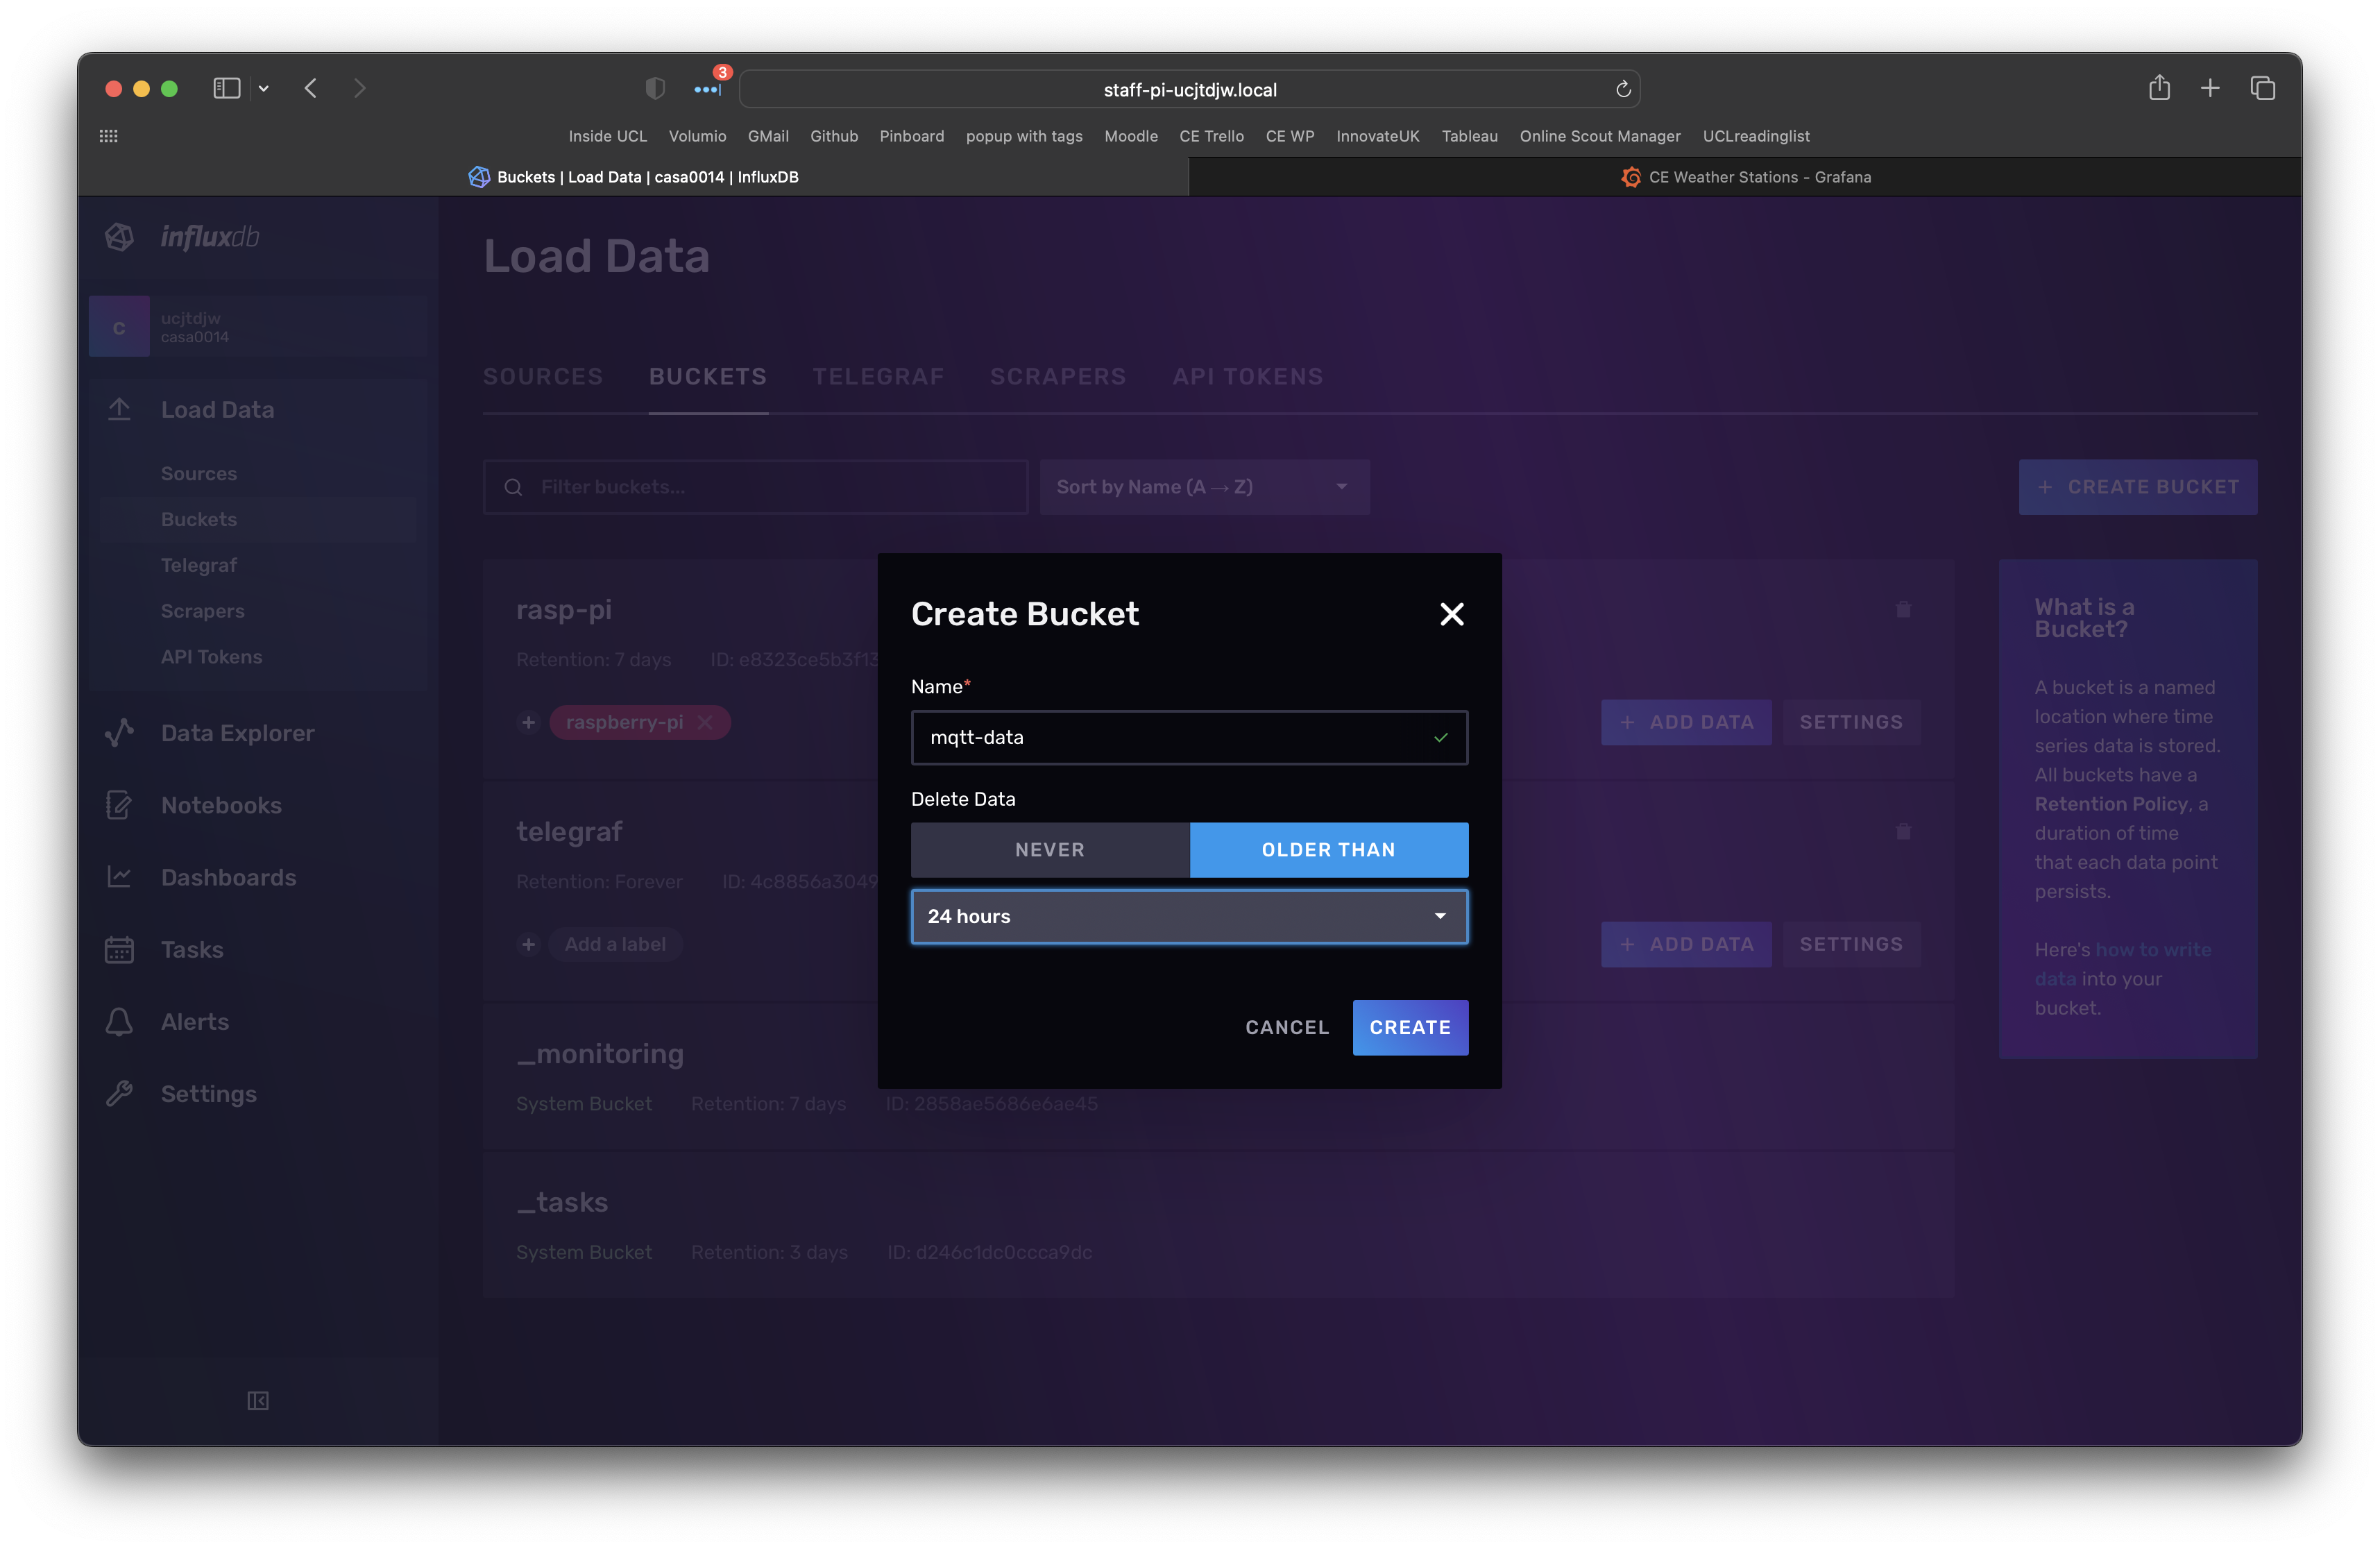
InfluxDB install is complete - we will now set-up a bucket called mqtt-data to hold our data from the mqtt feed of the sensor. Expand the left navigation (button at bottom left of window) and then select Buckets and select Create Bucket (button at top right). You should see a dialogue similar to below. Create a bucket called mqtt-data.
Telegraf is a time-series data collector - lots of information is available on the influxdata documentation site. They have some really thorough examples and teaching materials if you want to dig deeper into the functionality - it is a very powerful tool. The best way to learn what it can do is to setup some simple examples. These patterns are how we have configured the CE server infrastructure.
Step 1
Get back to the terminal on the RPi and install telegraf using the following command:
sudo apt-get update && sudo apt-get install telegraf -y
Step 2
Telegraf has lots of configuration options - the default file can be viewed at:
cat /etc/telegraf/telegraf.conf
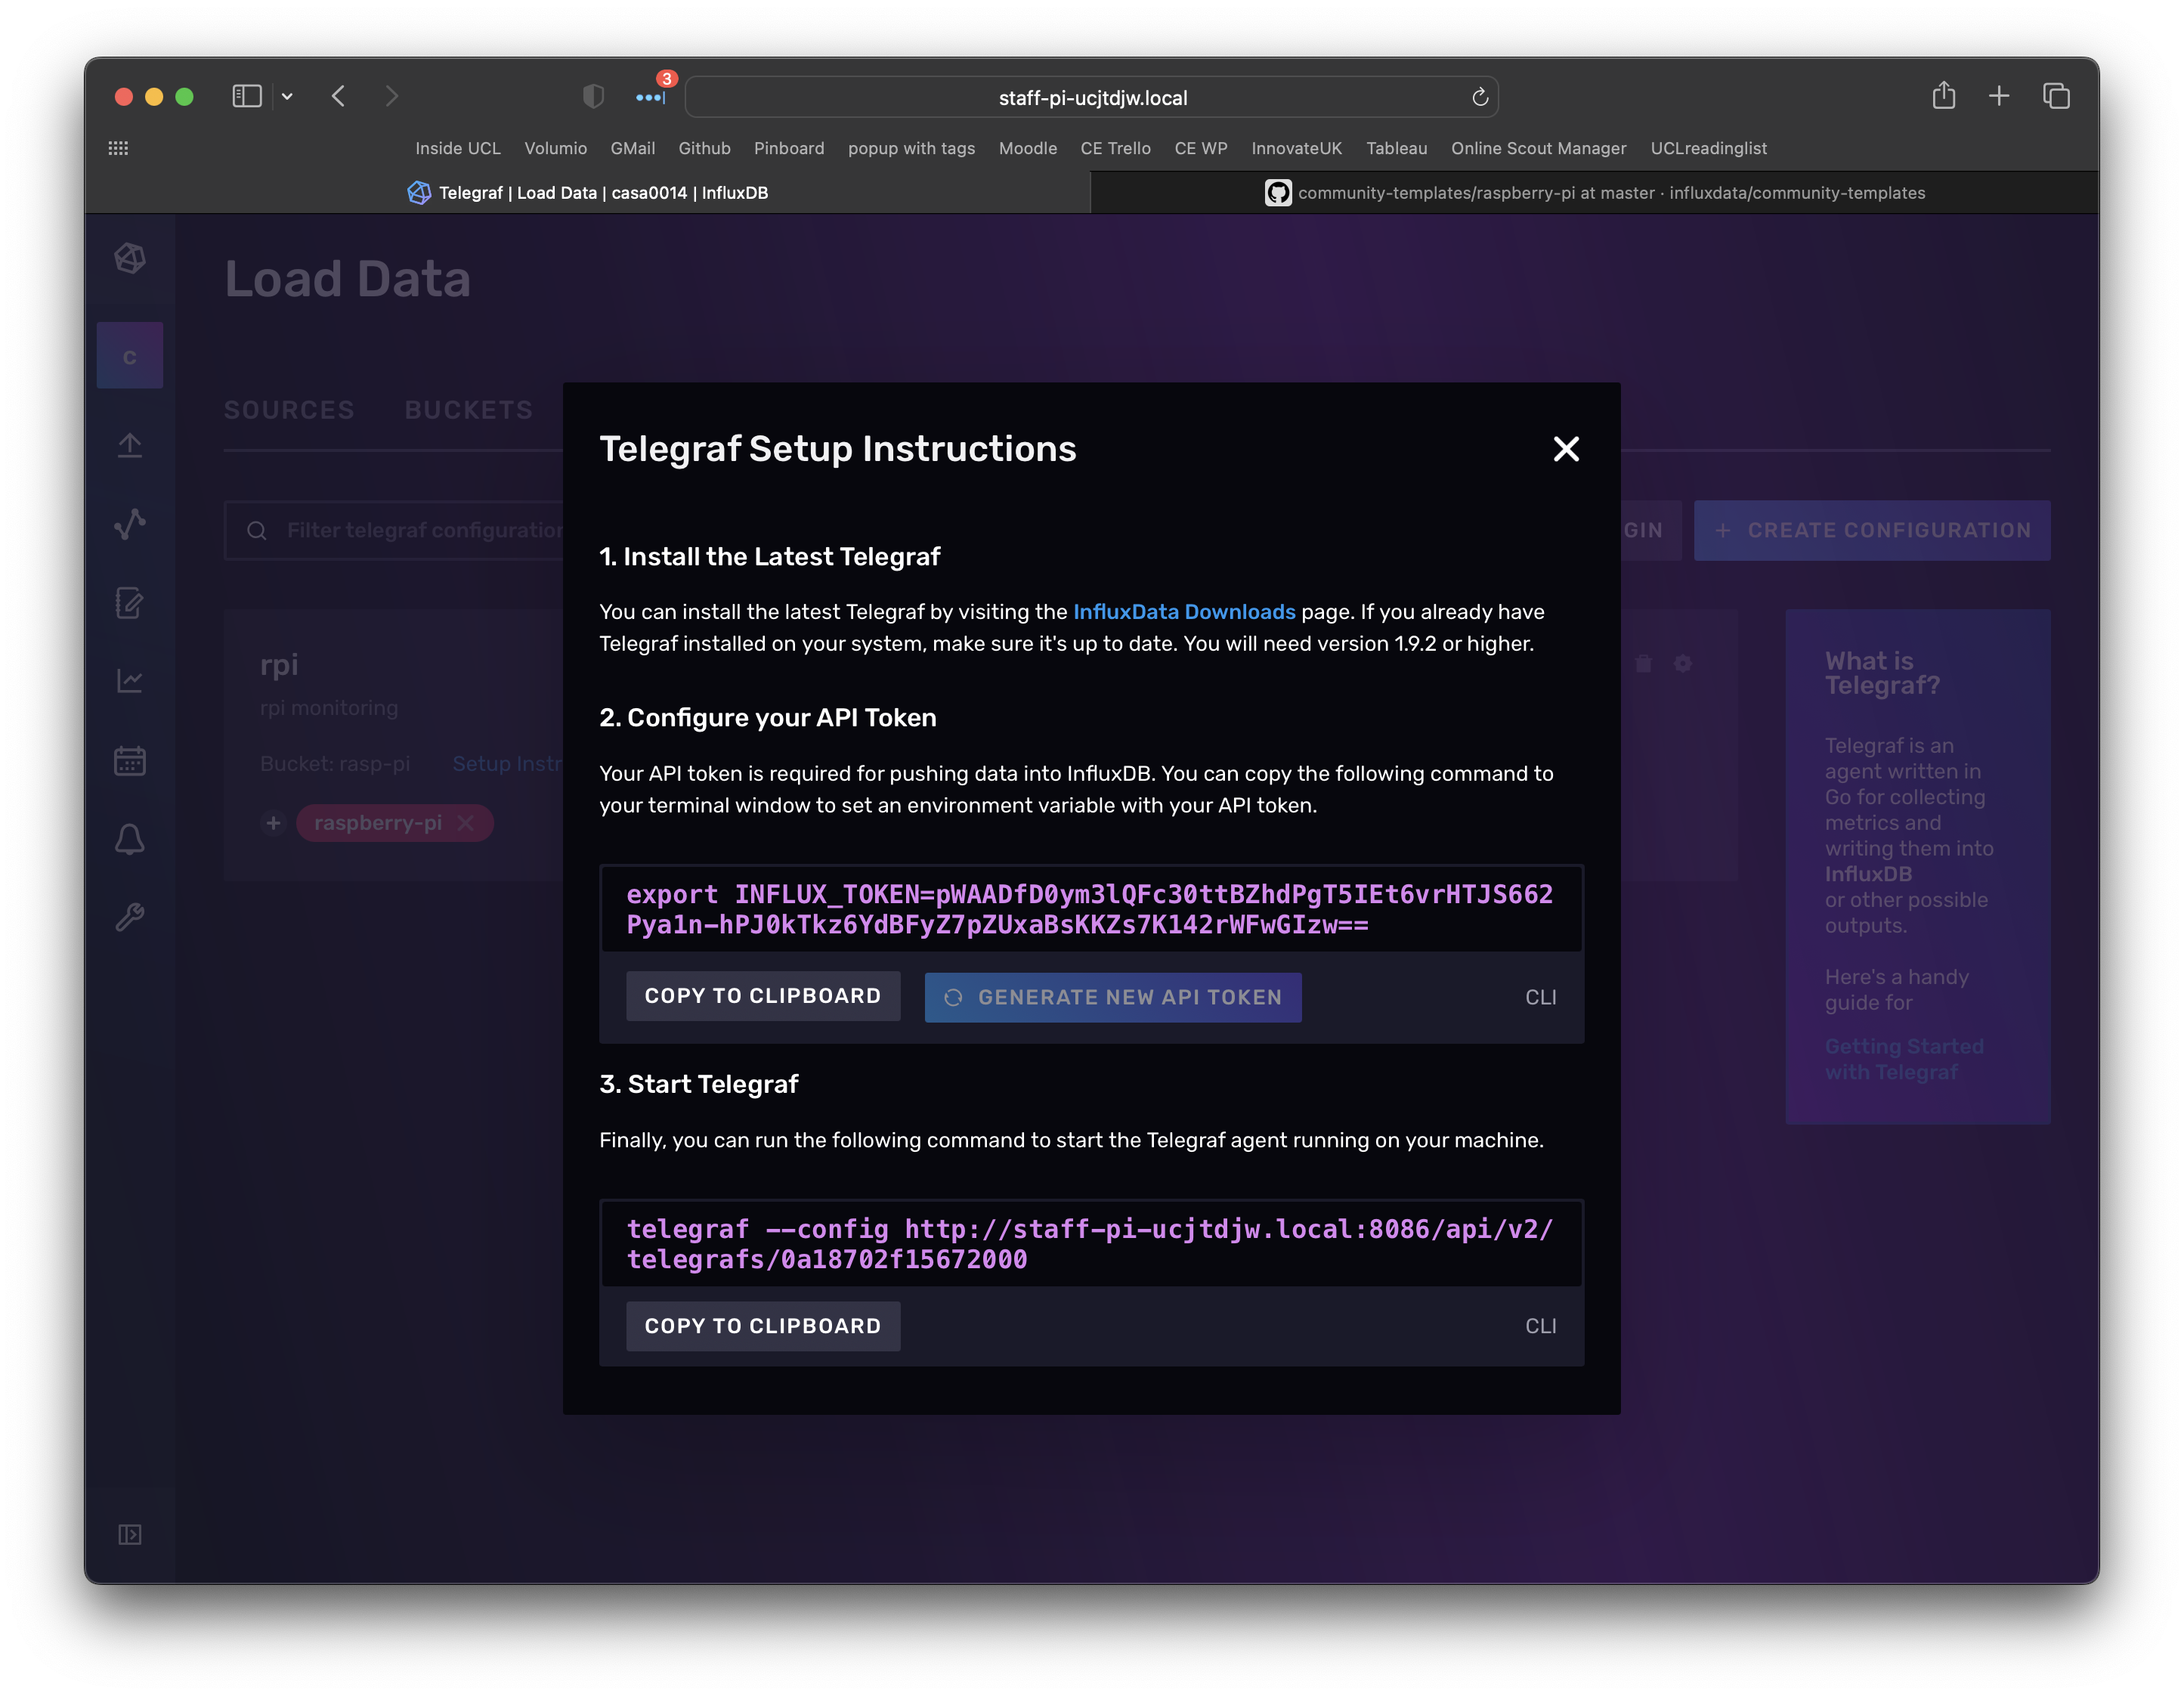
This file has hundreds of lines so don't worry too much about the contents. To get started we will use a minimal CE setup so that you can see the basic elements of a configuration. But first we will explore data from the RPi template we installed in the previous step to see how the telegraf scripts work. Browse to Load Data and select Telegraf.
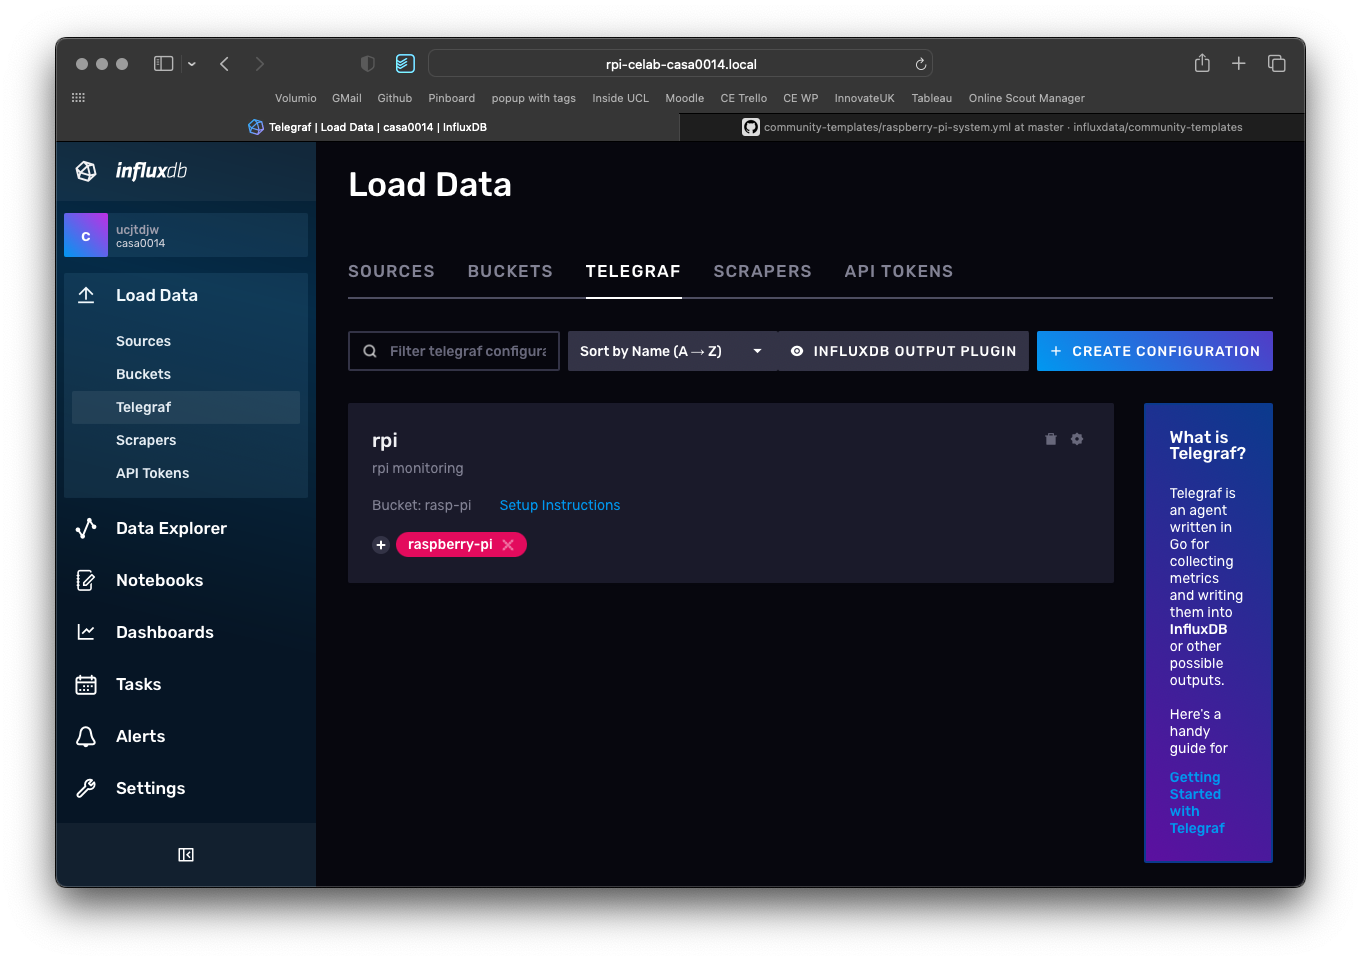
Then click on Setup instructions. You have already completed step 1 (install telegraf) but will need to do a couple of additional steps and then complete steps 2 and 3 on the command line by copy and pasting text in to the SSH shell on the RPi.
First up, define some PATH variables:
export INFLUX_HOST=http://10.129.101.214:8086
export INFLUX_ORG=casa0014
The third PATH variable you need to set is the TOKEN to get access to the Bucket. This is described in step 2 of the screenshot below. Click generate new API token and then copy and paste that into the command line.
export INFLUX_TOKEN=---you-will-have-your-own-token-here---
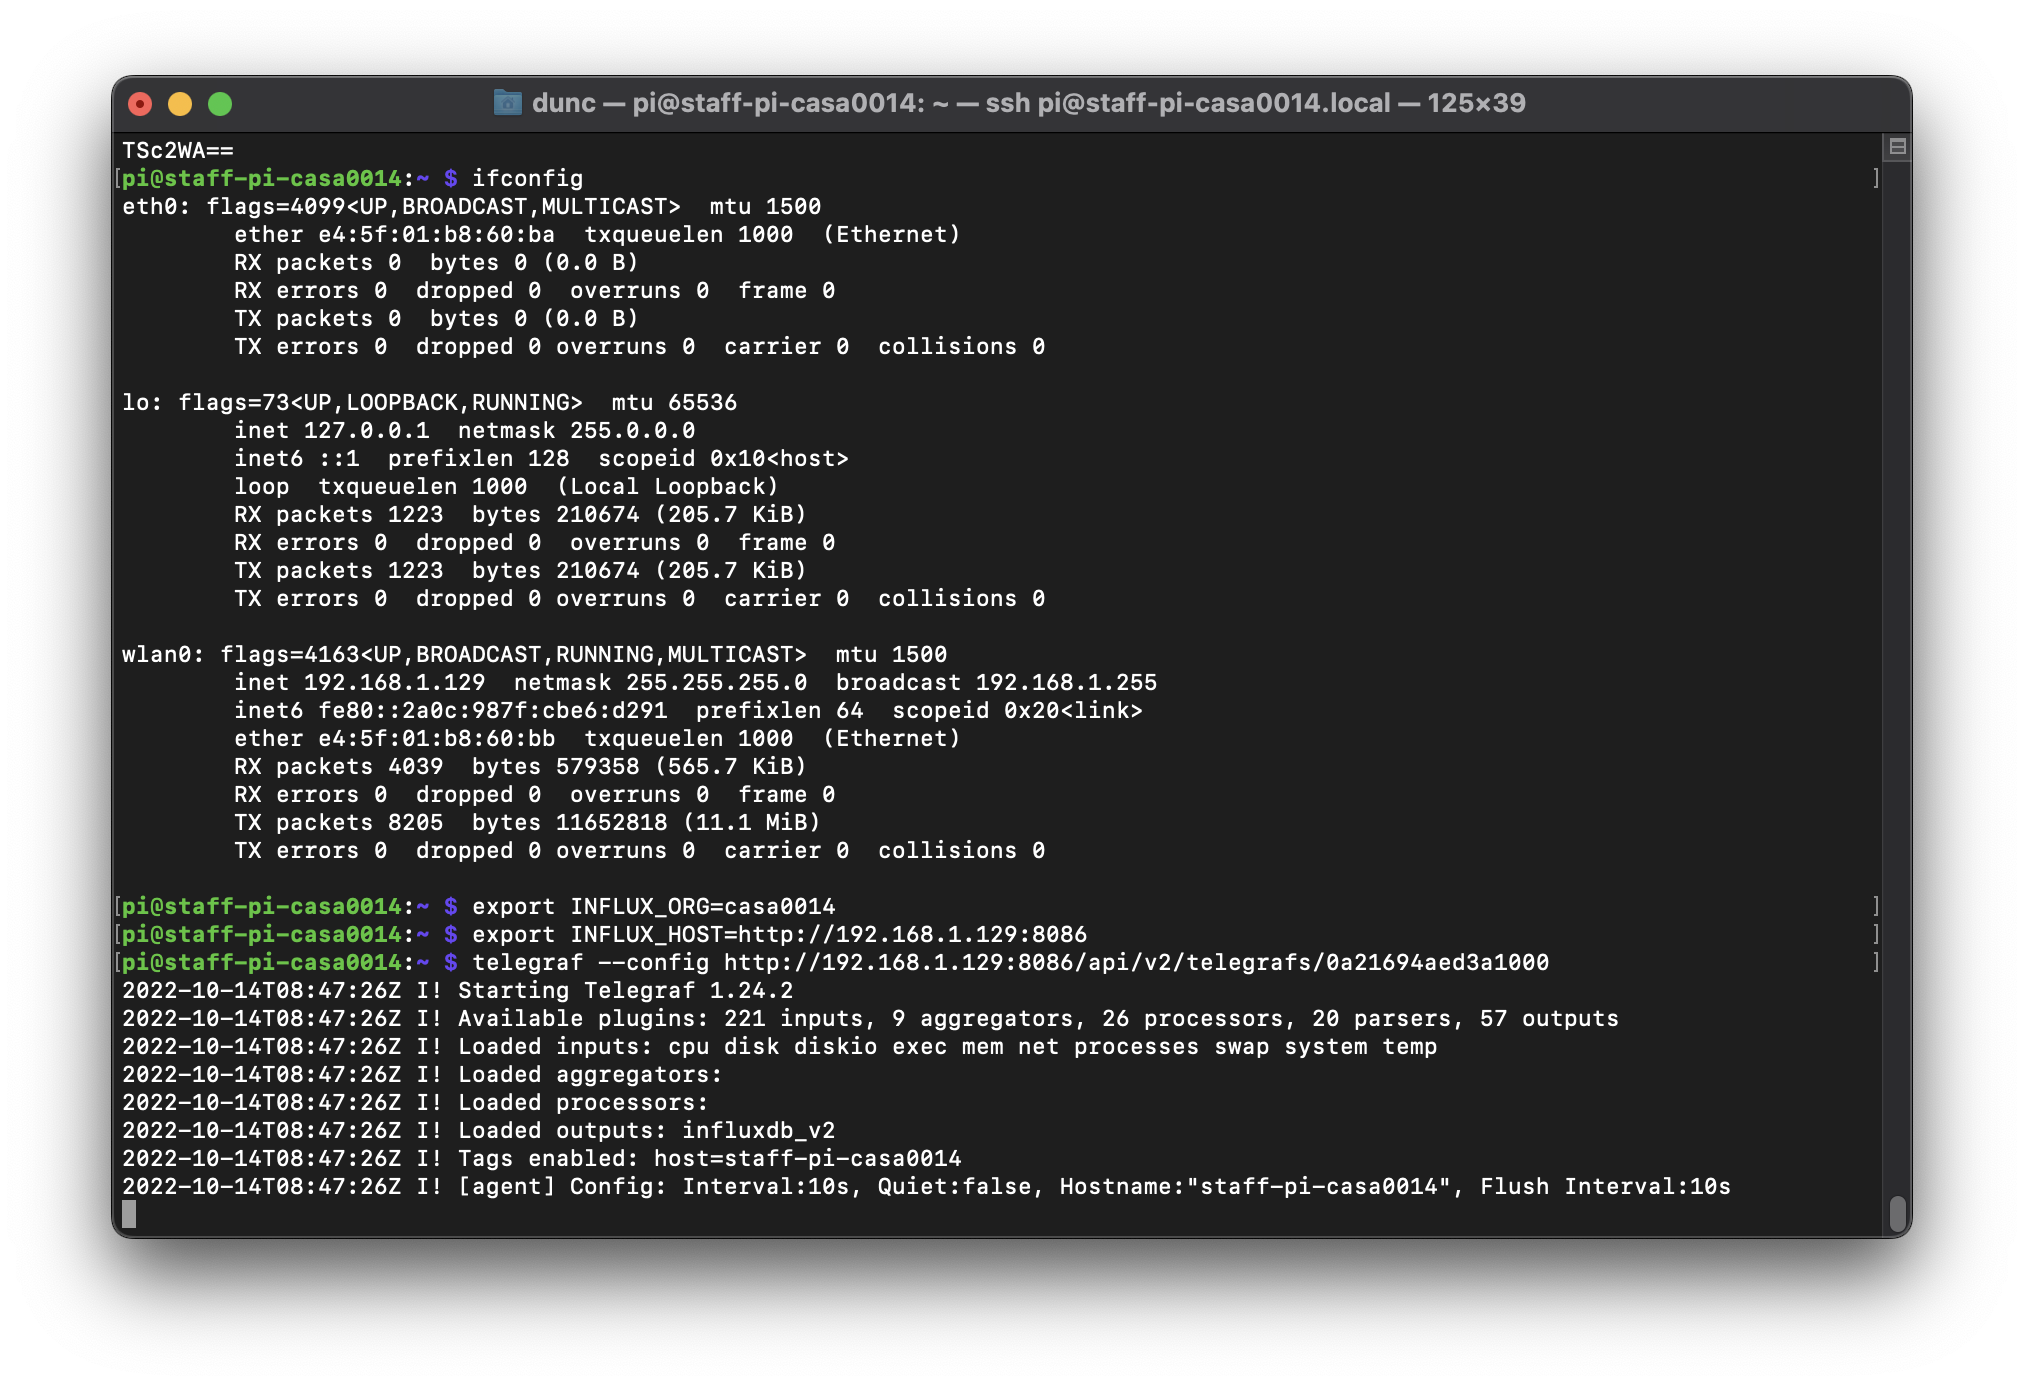
Finally you need to run telegraf and pass in the configuration file it needs to use - again we need to edit the command to replace the hostname with the IP address. I used:
telegraf --config http://10.129.101.214:8086/api/v2/telegrafs/0a2093eea36cb000
The terminal should now show a telegraf script running as per below:
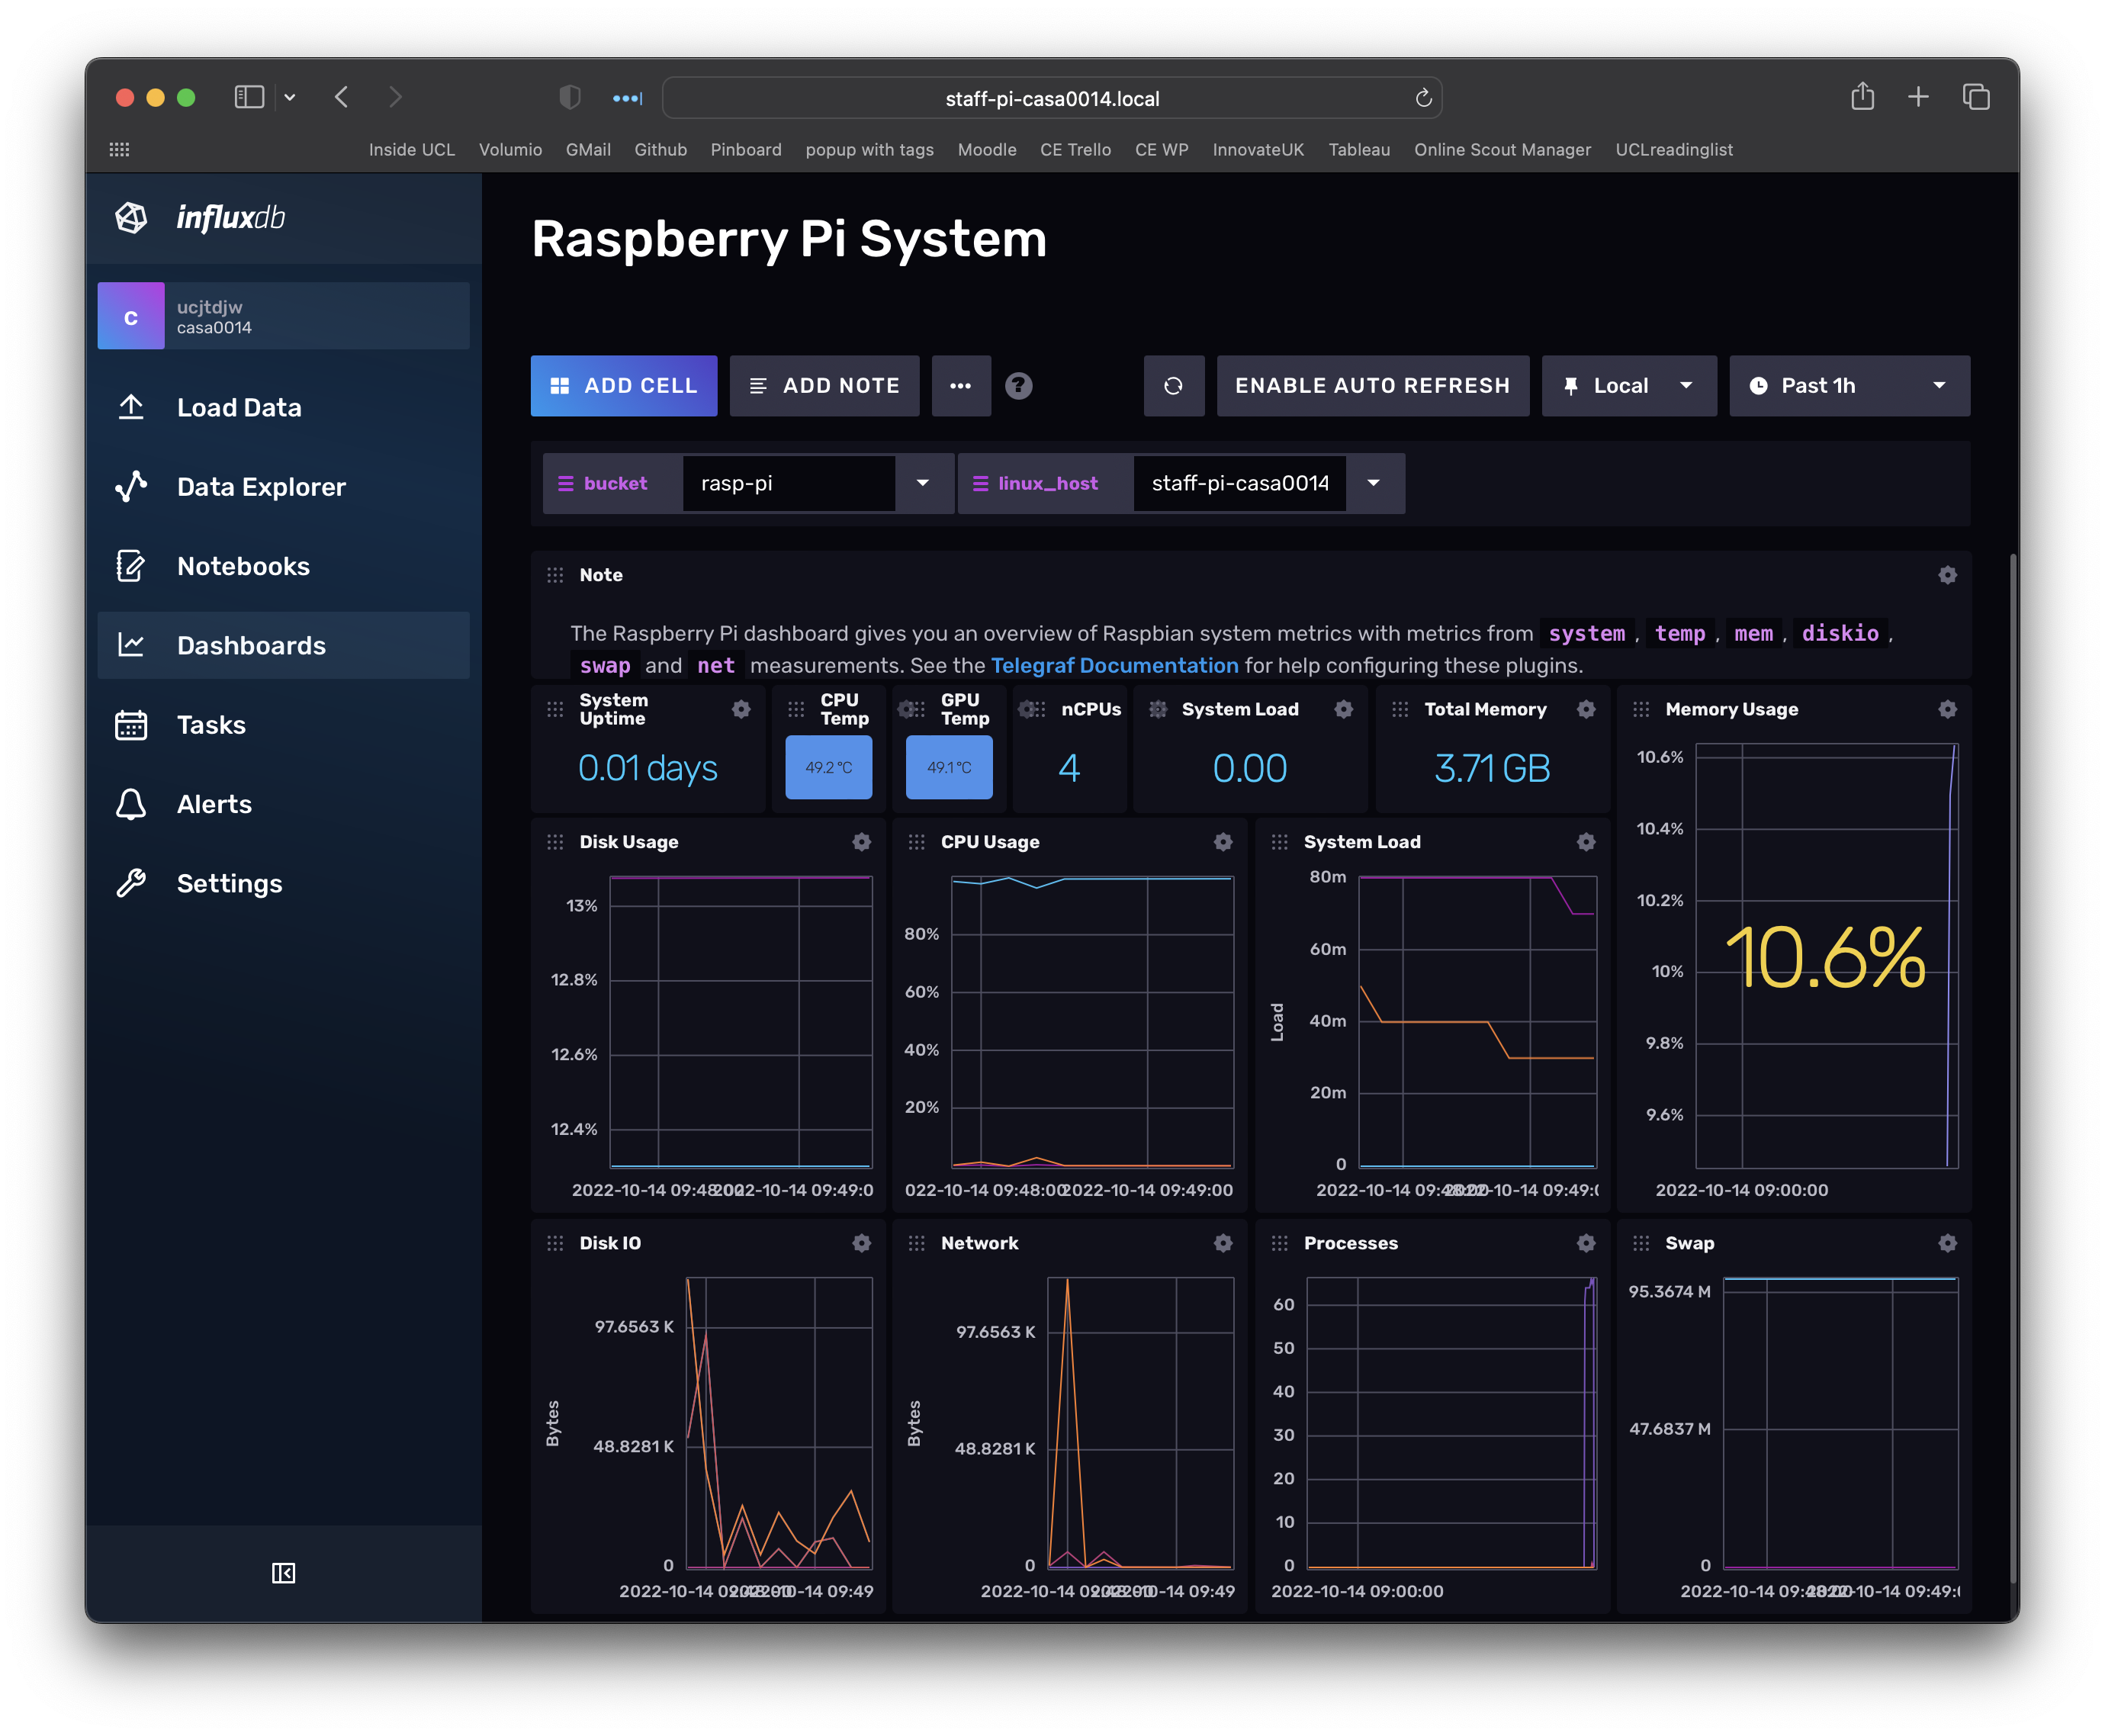
Back in InfluxDB you can go to the dashboards view and look at the template we downloaded for the RPi - this is taking data from the sensors on the RPi and inserting them into a Bucket called rasp-pi (make sure that is selected at the top of the dashboard if you are not seeing any data).
That telegraf agent is running live in the terminal using a config file that is stored in the web app (ie it is accessing it via the API). InfluxDB also has default configuration files stored in the local file system that get executed whenever InfluxDB is started. To make management of our plant monitor a little simpler we will edit the default configuration file on the RPi.
Open up the file on sample v2 configuration file on GitHub since we will use this as the basis for setting up your configuration file.
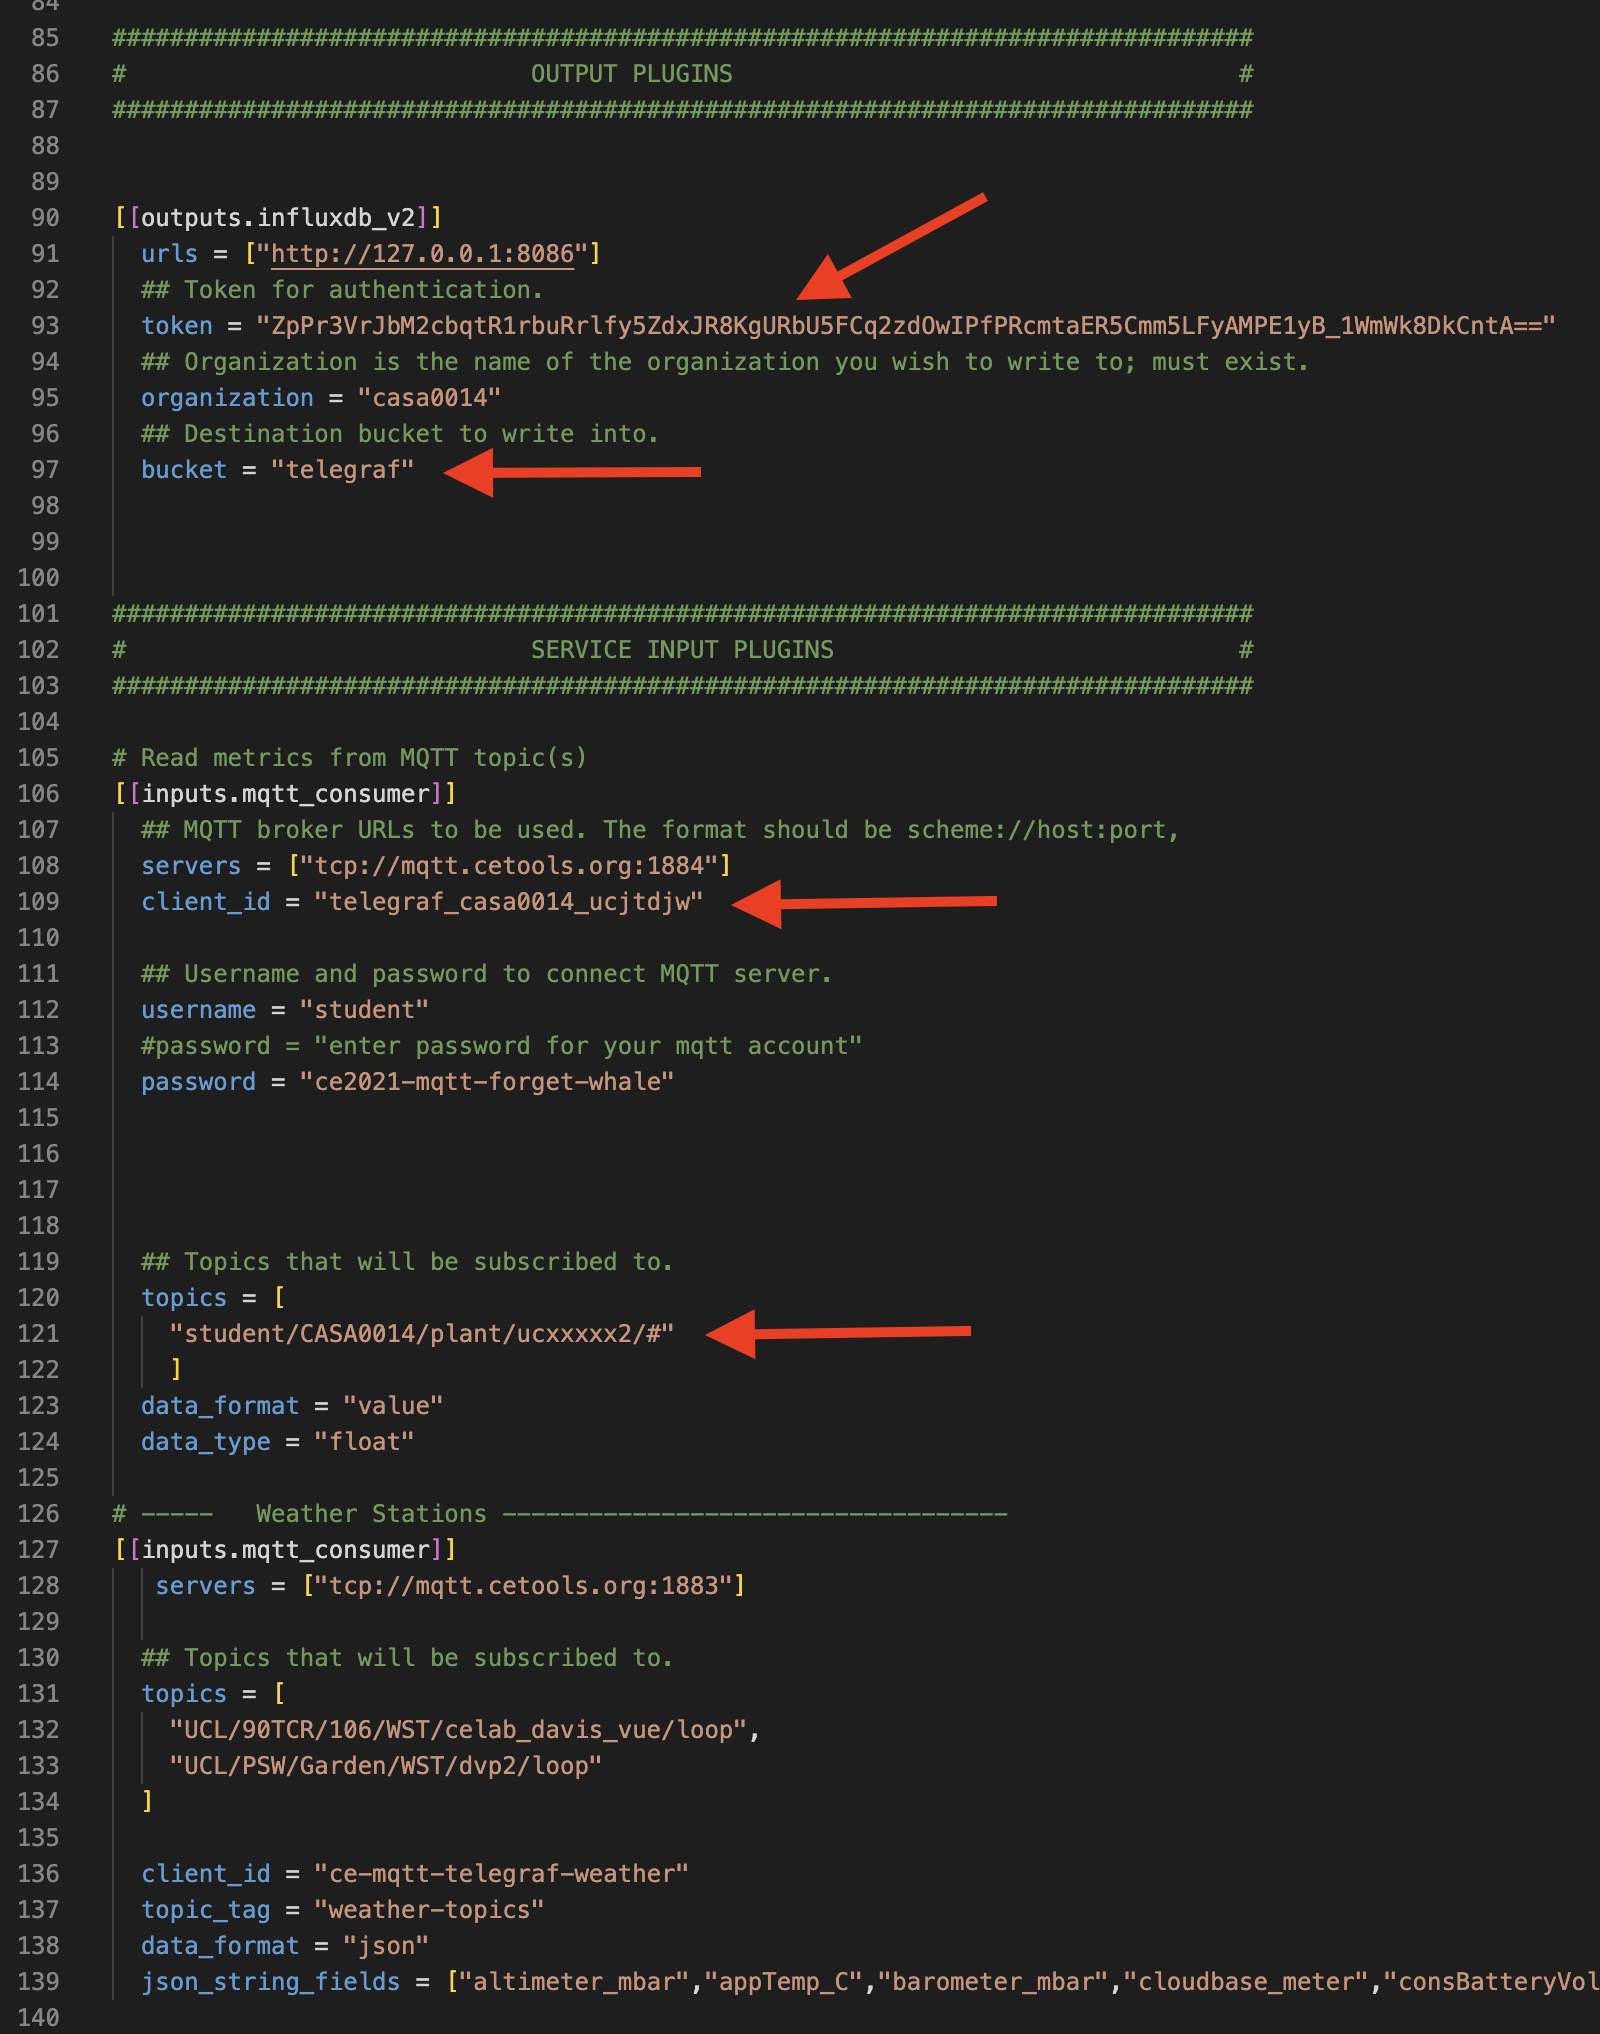
There are several variables that you will need to update. The red arrows below highlight them.
The first OUTPUT PLUGIN contains settings for the RPi sensors going into the rasp-pi bucket. You need to copy in your API token from the InfluxDB webpage for the raspberry pi - you will notice you will have 2 tokens in your Load Data > API Tokens page with different permissions - the main user one with all privileges and one restricted for actions on the rasp-pi bucket. For simplicity copy the user token since we will use here and in the next section.
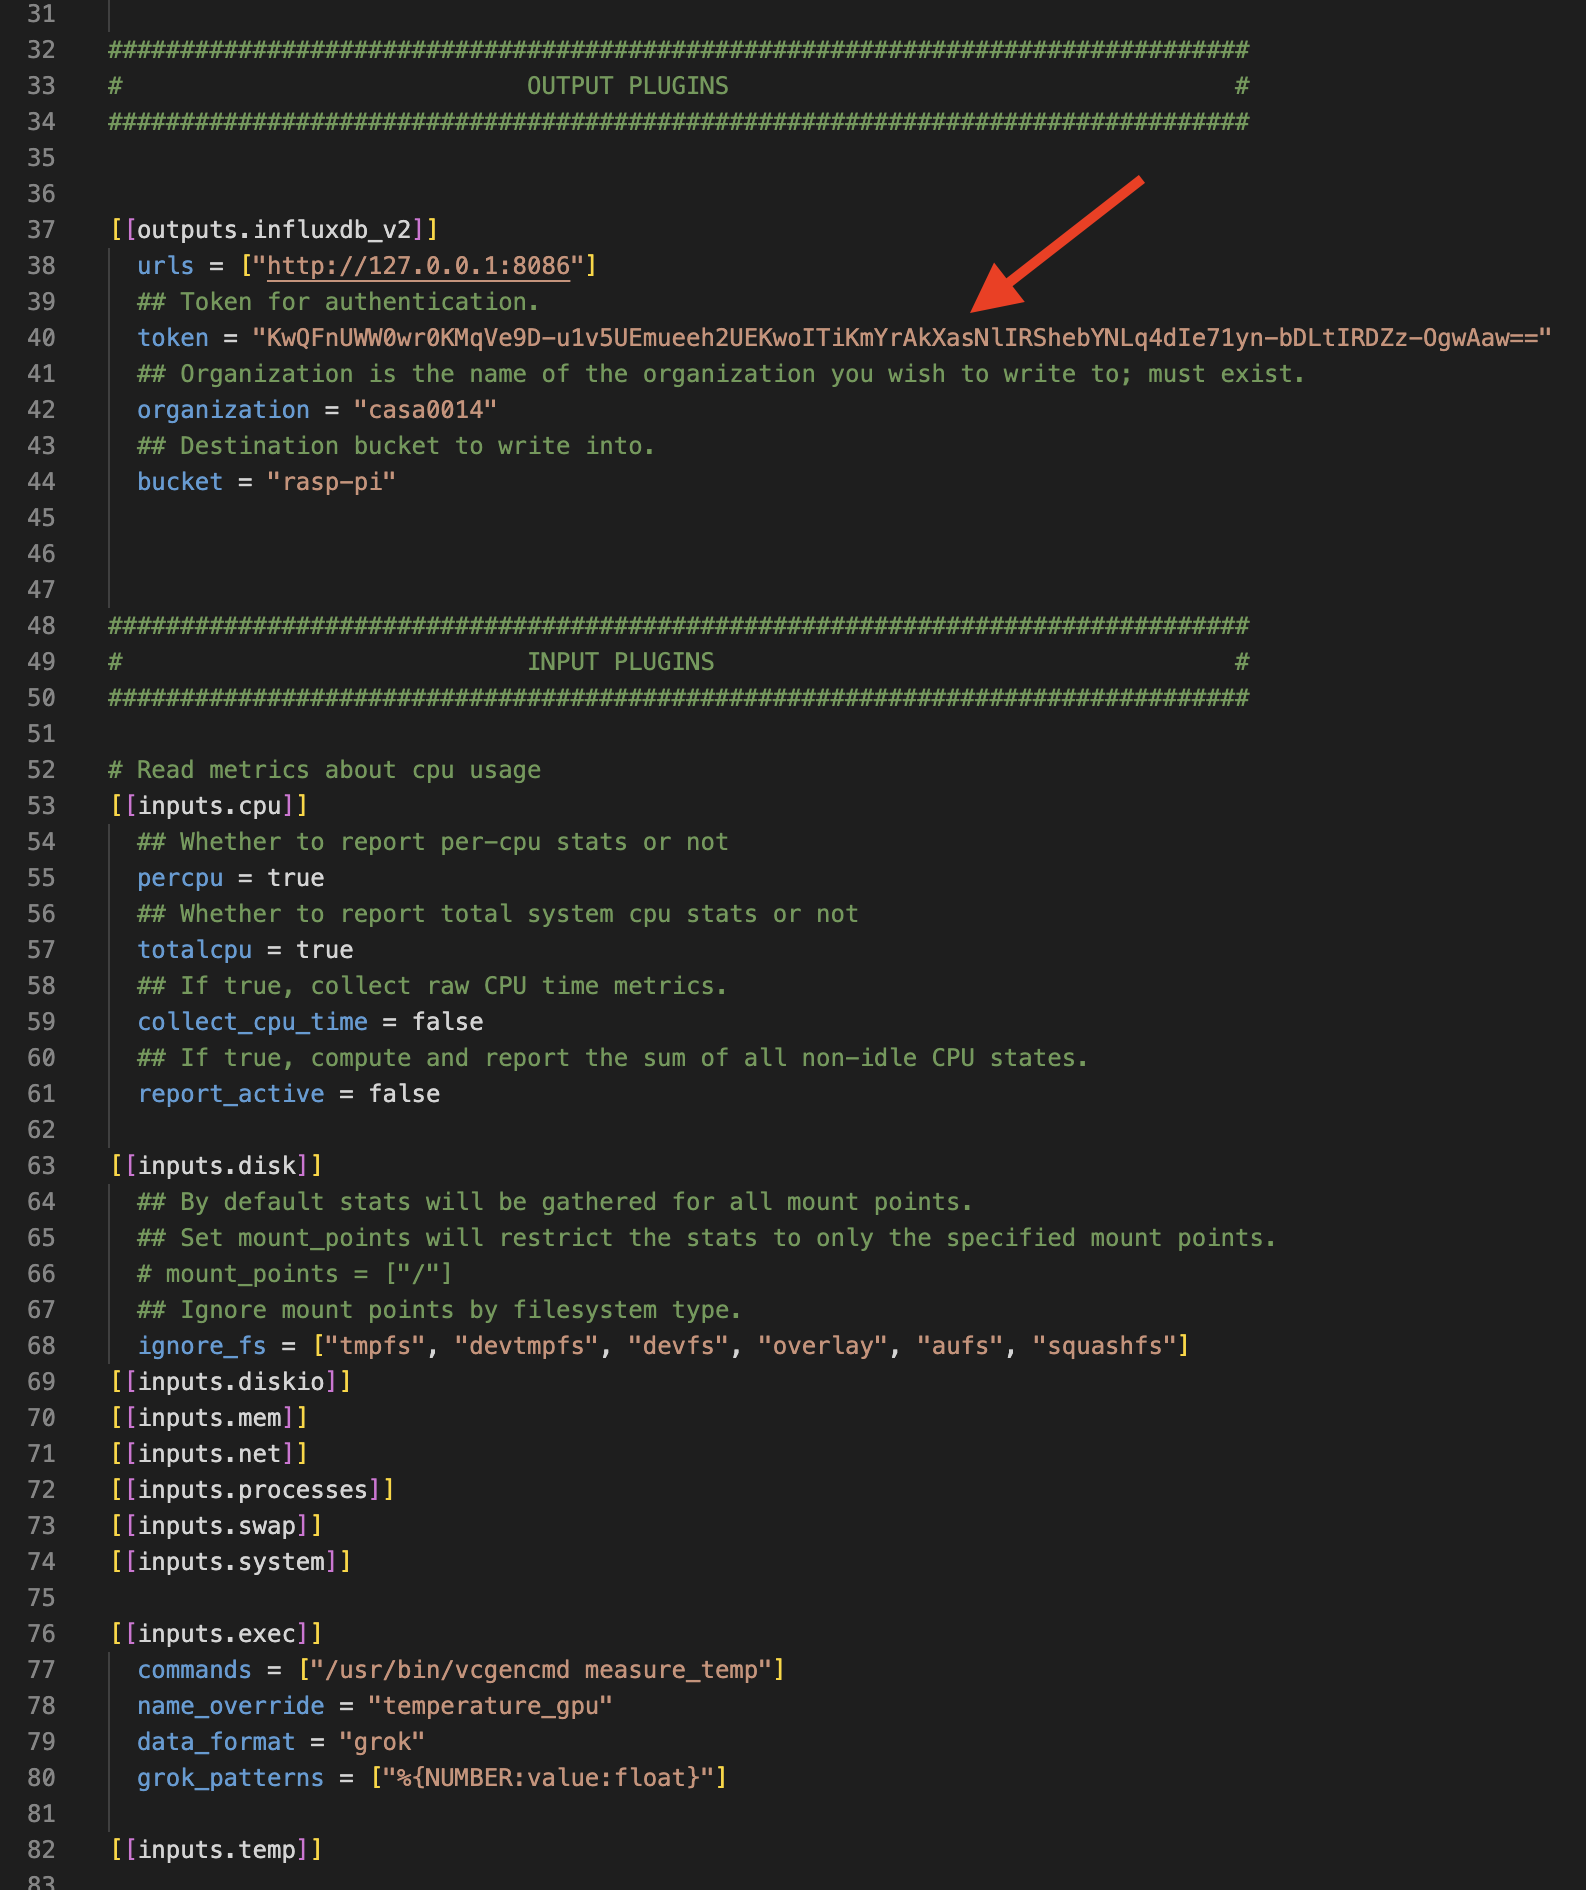
The second set of plugins pull from MQTT sensor data and push it into the mqtt-data bucket. This section has 4 items we need to change:
- copy your token again into this token field
- change the bucket for storing this data from
telegrafto the one we created calledmqtt-data - edit the client_ids so that they are unique to you (note there are 2 client_ids in the MQTT section)
- edit your topic name so that it contains your username - e.g. mine is
ucxxxxx2>ucjtdjw
Save the file and then we will copy it across to the RPi. One way to do this is to use Nano to edit the file. First we will take a copy of the original file for reference and then will create a new simplified one.
sudo mv /etc/telegraf/telegraf.conf /etc/telegraf/telegraf-original.conf
sudo nano /etc/telegraf/telegraf.conf
You shoud now see an empty nano file - copy paste your config file contents into this file and hit CTRL X to exit and save.
Restart the influxdb service for the configurations to be set and check the status:
sudo systemctl stop influxdb
sudo systemctl start influxdb
sudo systemctl status influxdb
sudo systemctl start telegraf
sudo systemctl status telegraf
You should now be able to explore the data through the Data Explorer
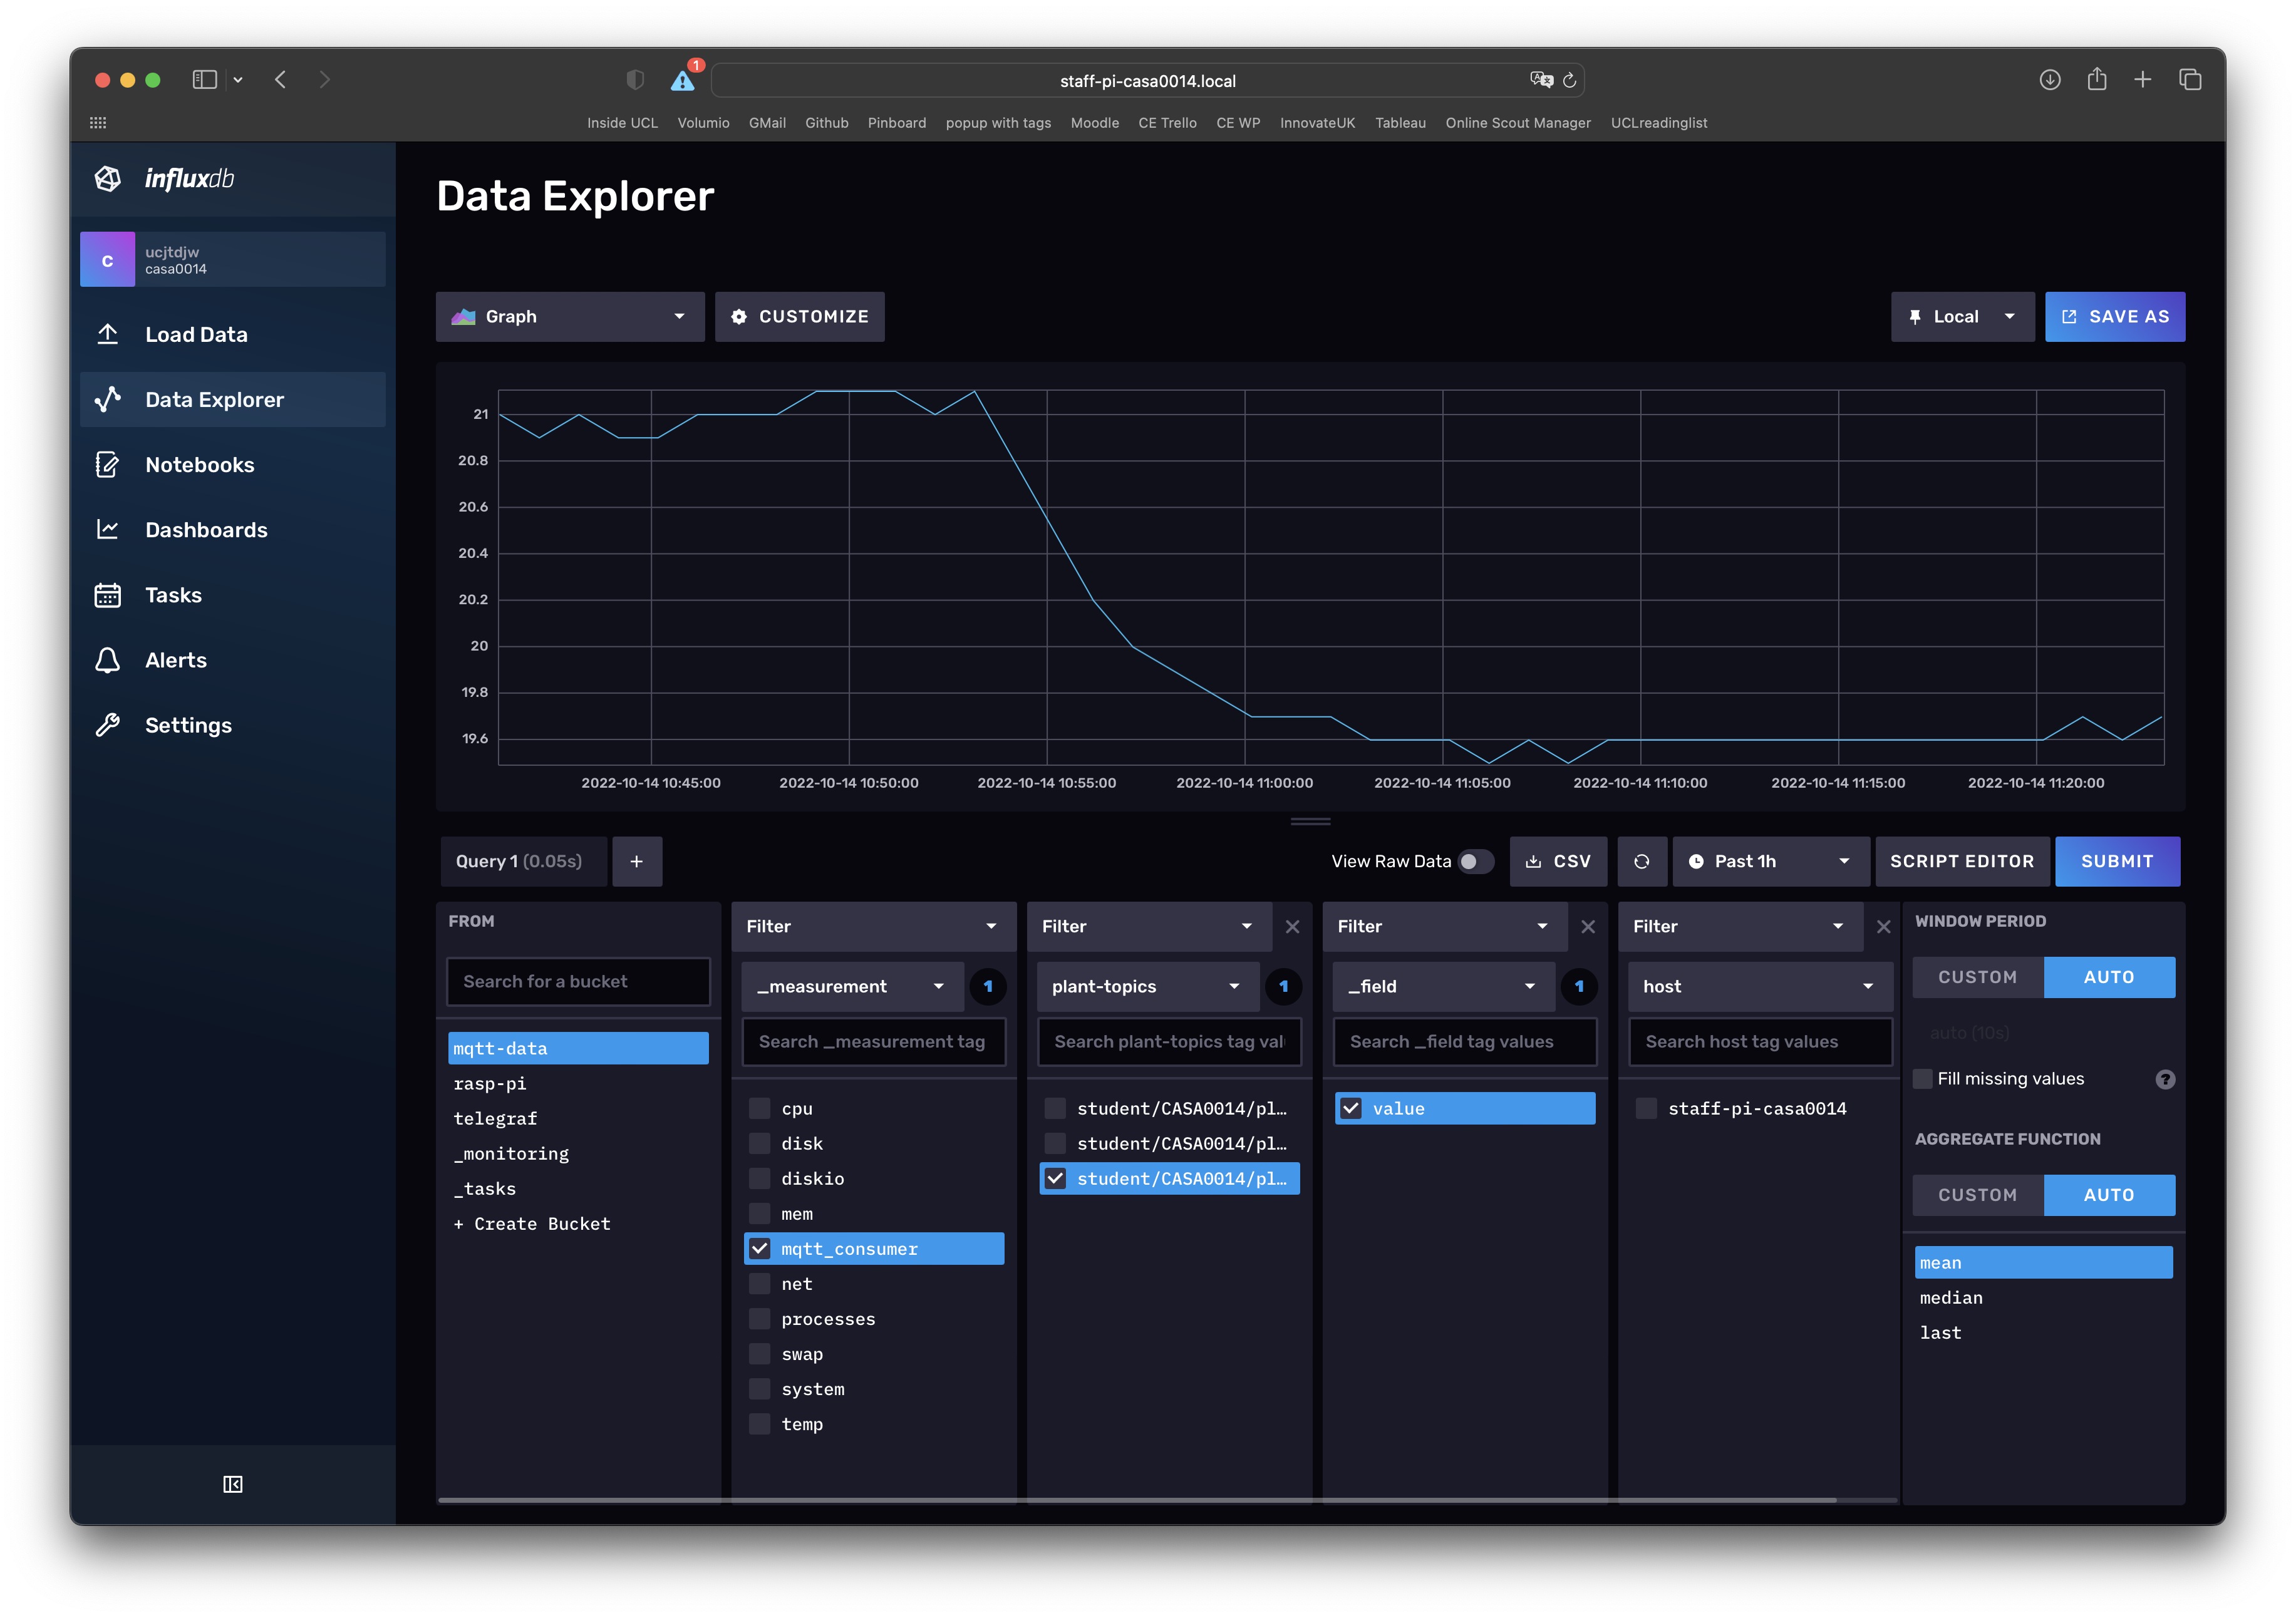
Example code for the Data Explorer is below and a Dashboards template has been included in the casa0014 GitHub repo
from(bucket: "mqtt-data")
  |> range(start: v.timeRangeStart, stop: v.timeRangeStop)
  |> filter(fn: (r) => r["_measurement"] == "mqtt_consumer")
  |> filter(fn: (r) => r["plant-topics"] == "student/CASA0014/plant/ucjtdjw/temperature")
  |> filter(fn: (r) => r["_field"] == "value")
  |> aggregateWindow(every: v.windowPeriod, fn: mean, createEmpty: false)
  |> yield(name: "mean")
and with a regular expression...
from(bucket: "mqtt-data")
  |> range(start: v.timeRangeStart, stop: v.timeRangeStop)
  |> filter(fn: (r) => r["_measurement"] == "mqtt_consumer")
  |> filter(fn: (r) => r["topic"] =~ /plant.*/)
  |> filter(fn: (r) => r["_field"] == "value")
  |> aggregateWindow(every: v.windowPeriod, fn: mean, createEmpty: false)
  |> yield(name: "mean")
and with the CE weather station data...
from(bucket: "mqtt-data")
  |> range(start: v.timeRangeStart, stop: v.timeRangeStop)
  |> filter(fn: (r) => r["weather-topics"] == "UCL/PSW/Garden/WST/dvp2/loop")
  |> filter(fn: (r) => r["_field"] == "appTemp_C")
  |> keep(columns: ["_value", "_time", "weather-topics", "_field"])
  |> map(fn:(r) => ({ r with
      _value: float(v: r["_value"])
    }))
  |> keep(columns: ["weather-topics", "_value", "_field", "_time"])
  |> aggregateWindow(every: v.windowPeriod, fn: mean, createEmpty: false)
In the final step we will install Grafana so that we can visualise the data in the InfluxDB. Open the Grafana download page and follow the instructions to install the "Ubuntu and Debian (Arm64)" install:
sudo apt-get install -y adduser libfontconfig1 musl
wget https://dl.grafana.com/enterprise/release/grafana-enterprise_10.1.5_arm64.deb
sudo dpkg -i grafana-enterprise_10.1.5_arm64.deb
Once installed make sure to follow the in terminal instructions to add grafana to systemd and then to start the service:
sudo /bin/systemctl daemon-reload
sudo /bin/systemctl enable grafana-server
sudo /bin/systemctl start grafana-server
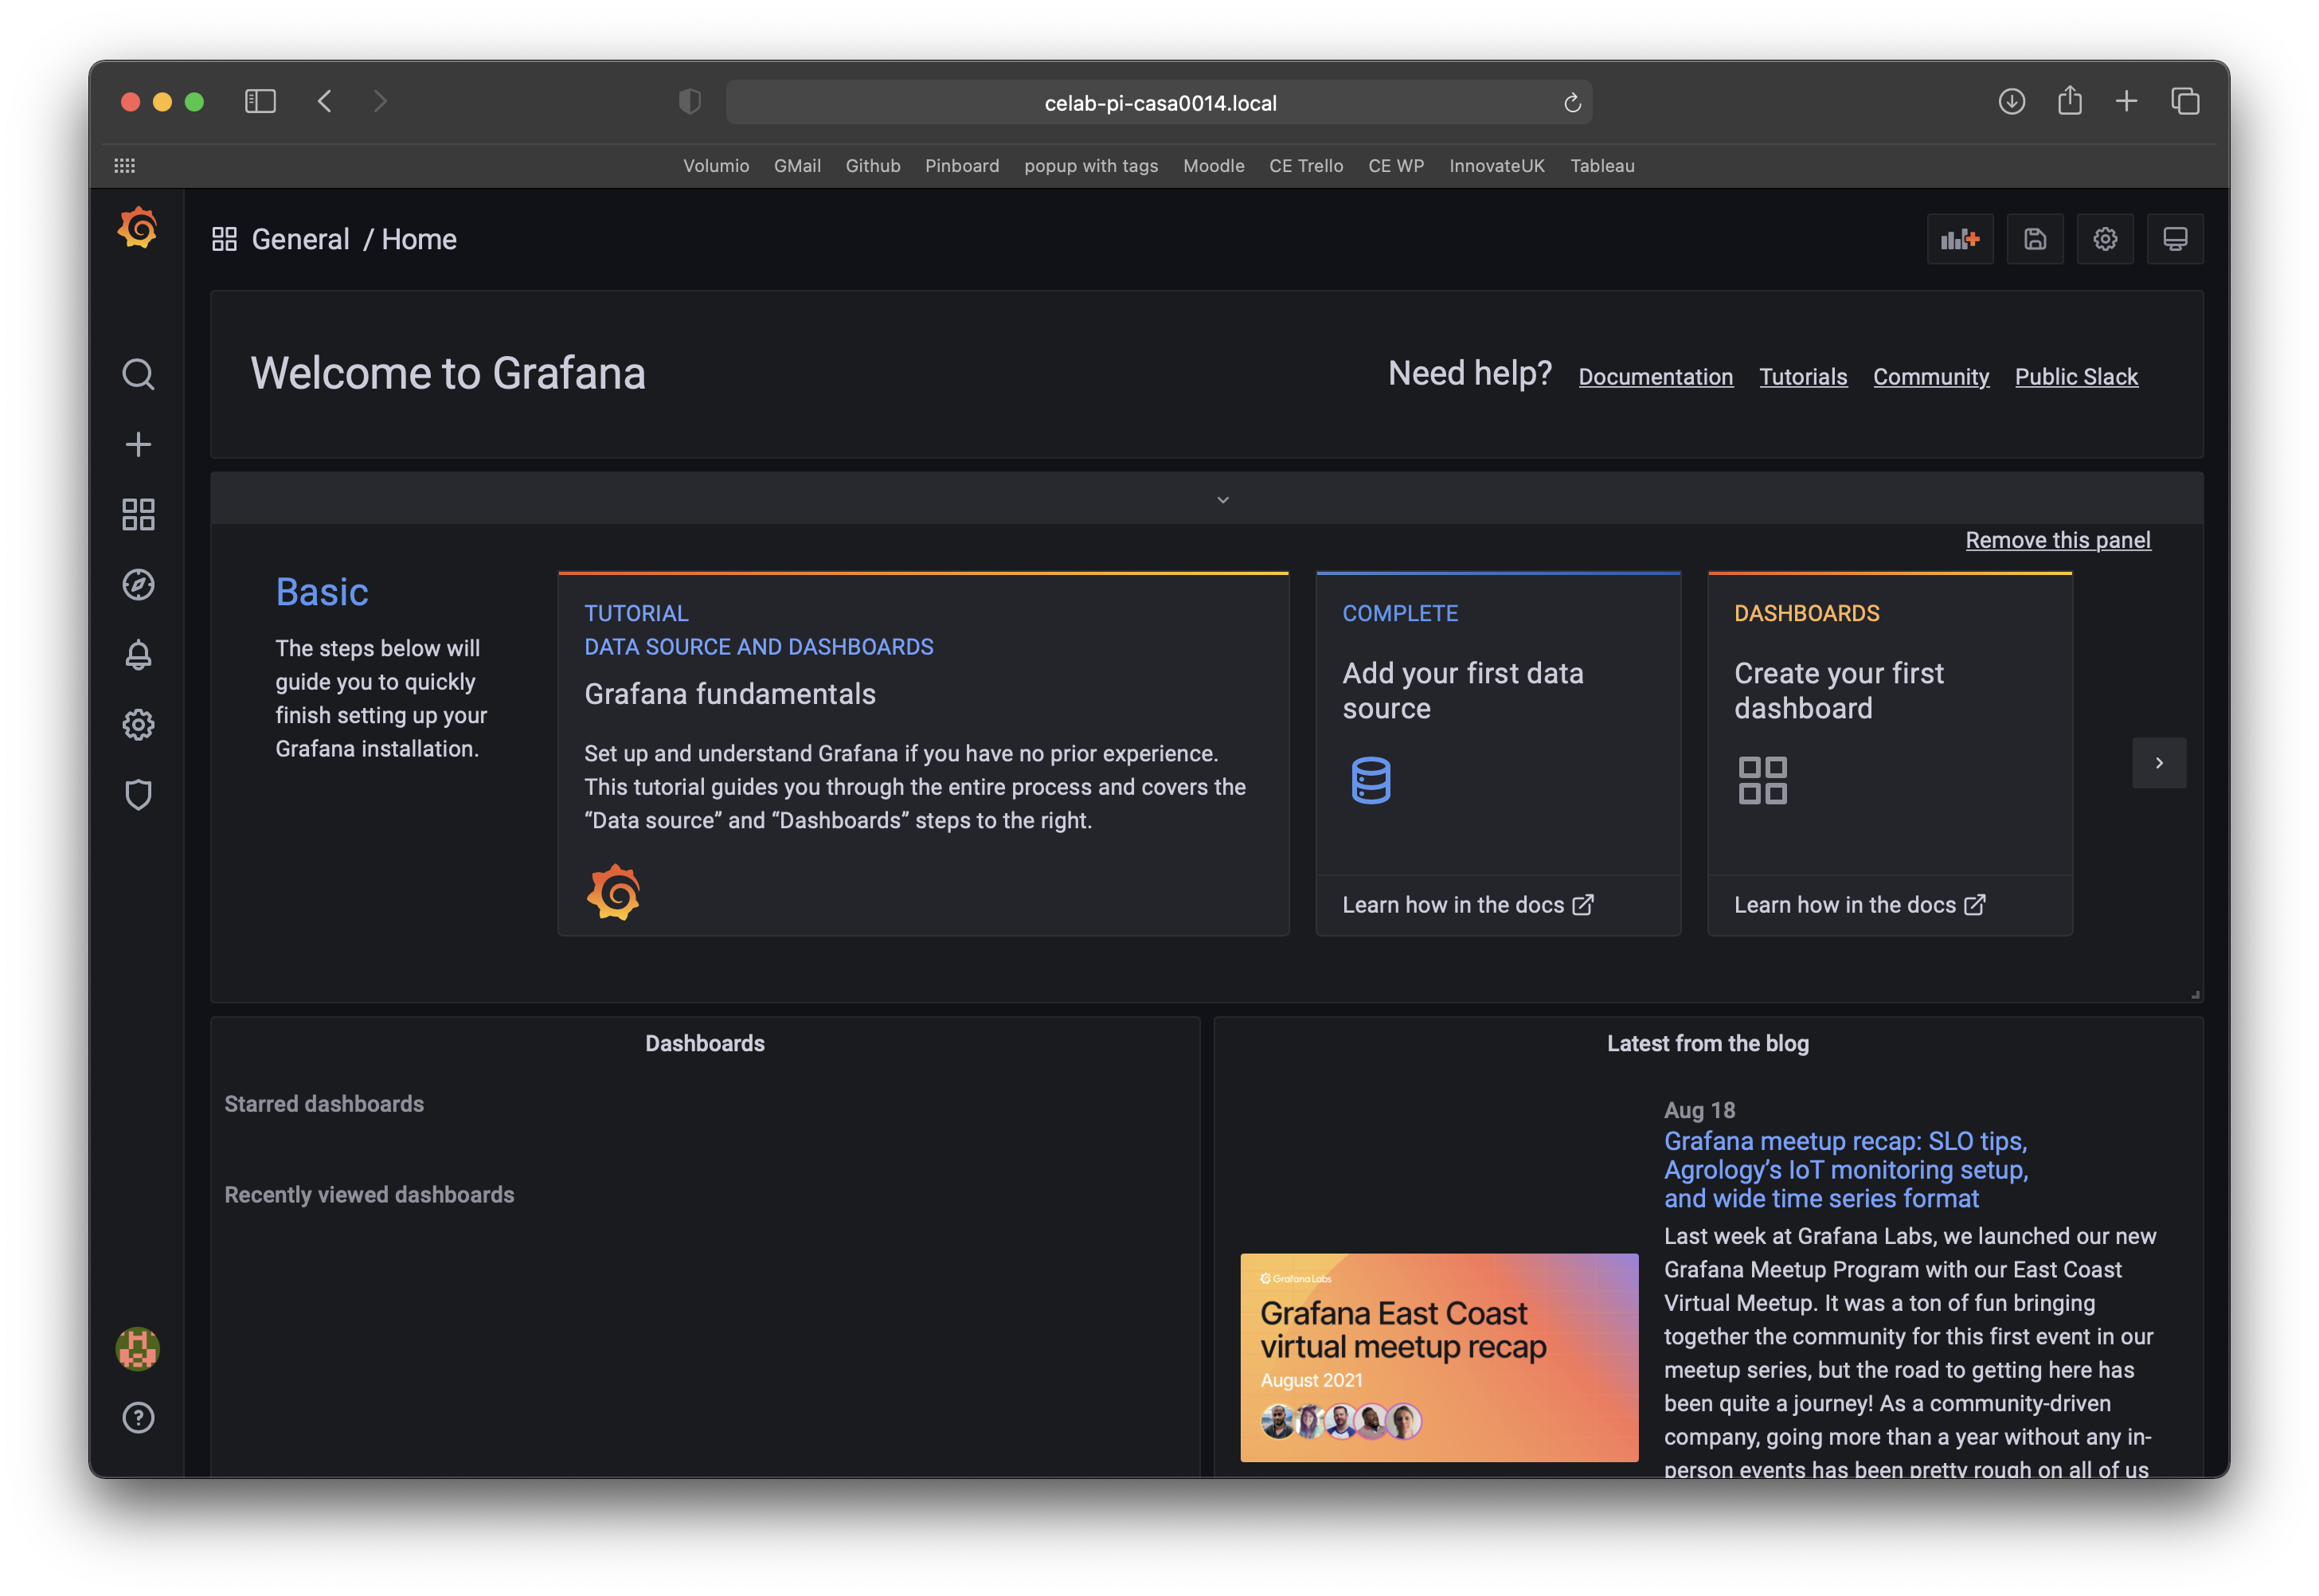
You should now be able to browse to http://localhost:3000 and see the Grafana welcome page - the default user pass is admin admin
Similar to the previous two tools Grafana also has a documentation page for the config file
For some useful resources and for the query syntax of the TS tables look at:
https://docs.influxdata.com/influxdb/v2.4/
In this final step we will set up a Grafana dashboard so that you can visualise your sensed data. Grafana was installed above so open a browser and go the address http://staff-pi-casa0014.local:3000 where the middle bit is the address of your Raspberry Pi. Note that we are connecting on port 3000. You should be asked to login - use the default admin admin and skip changing the password when prompted. You should see a welcome screen like:
In the middle of the dashboard you should see a prompt to Add your first datasource click on that and fill out the following details:
- select InfluxDB
- select Flux as the Query Language (needed for v2 of InfluxDB)
- add
http://127.0.0.1:8086at the URL - deselect
basic auth - add org name and copy in your user API token from InfluxDB
- add
mqtt-dataas the default bucket
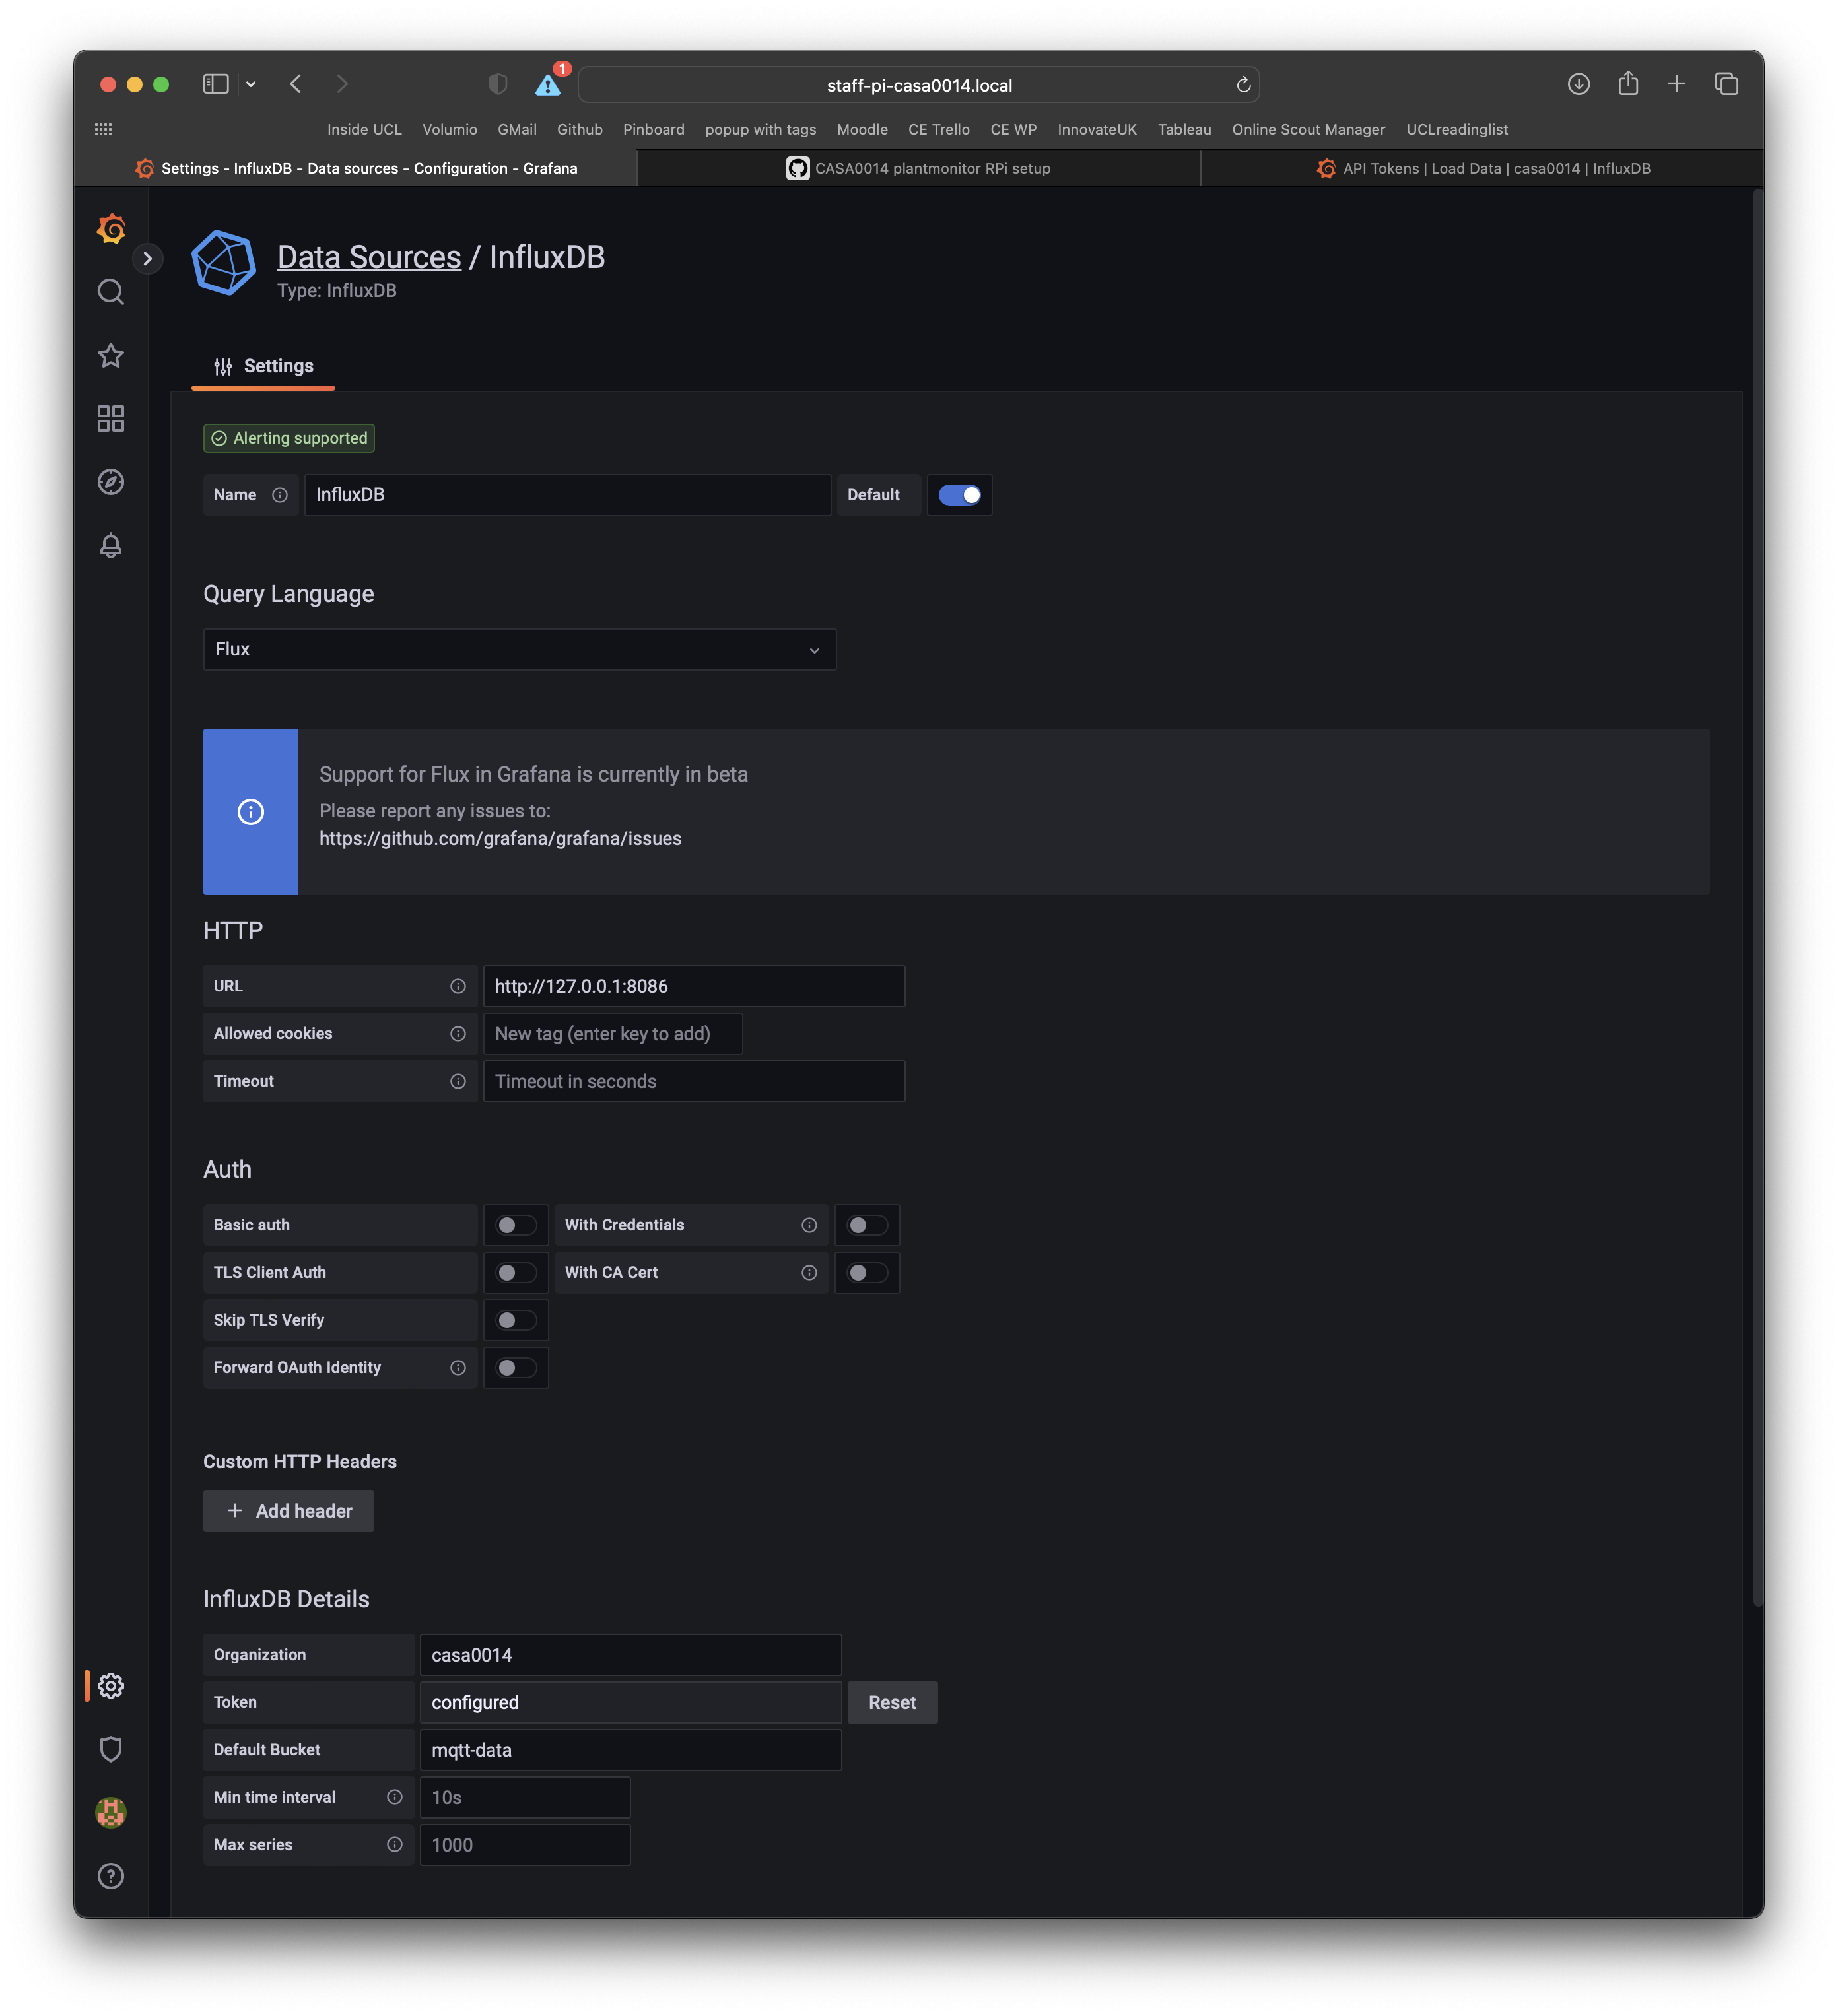
Select save and test at the bottom of the page to check the connection works.
You can always get back to this settings page by following the Configuration item in the left hand menu and selecting Datasources (Icon looks like a small cog).
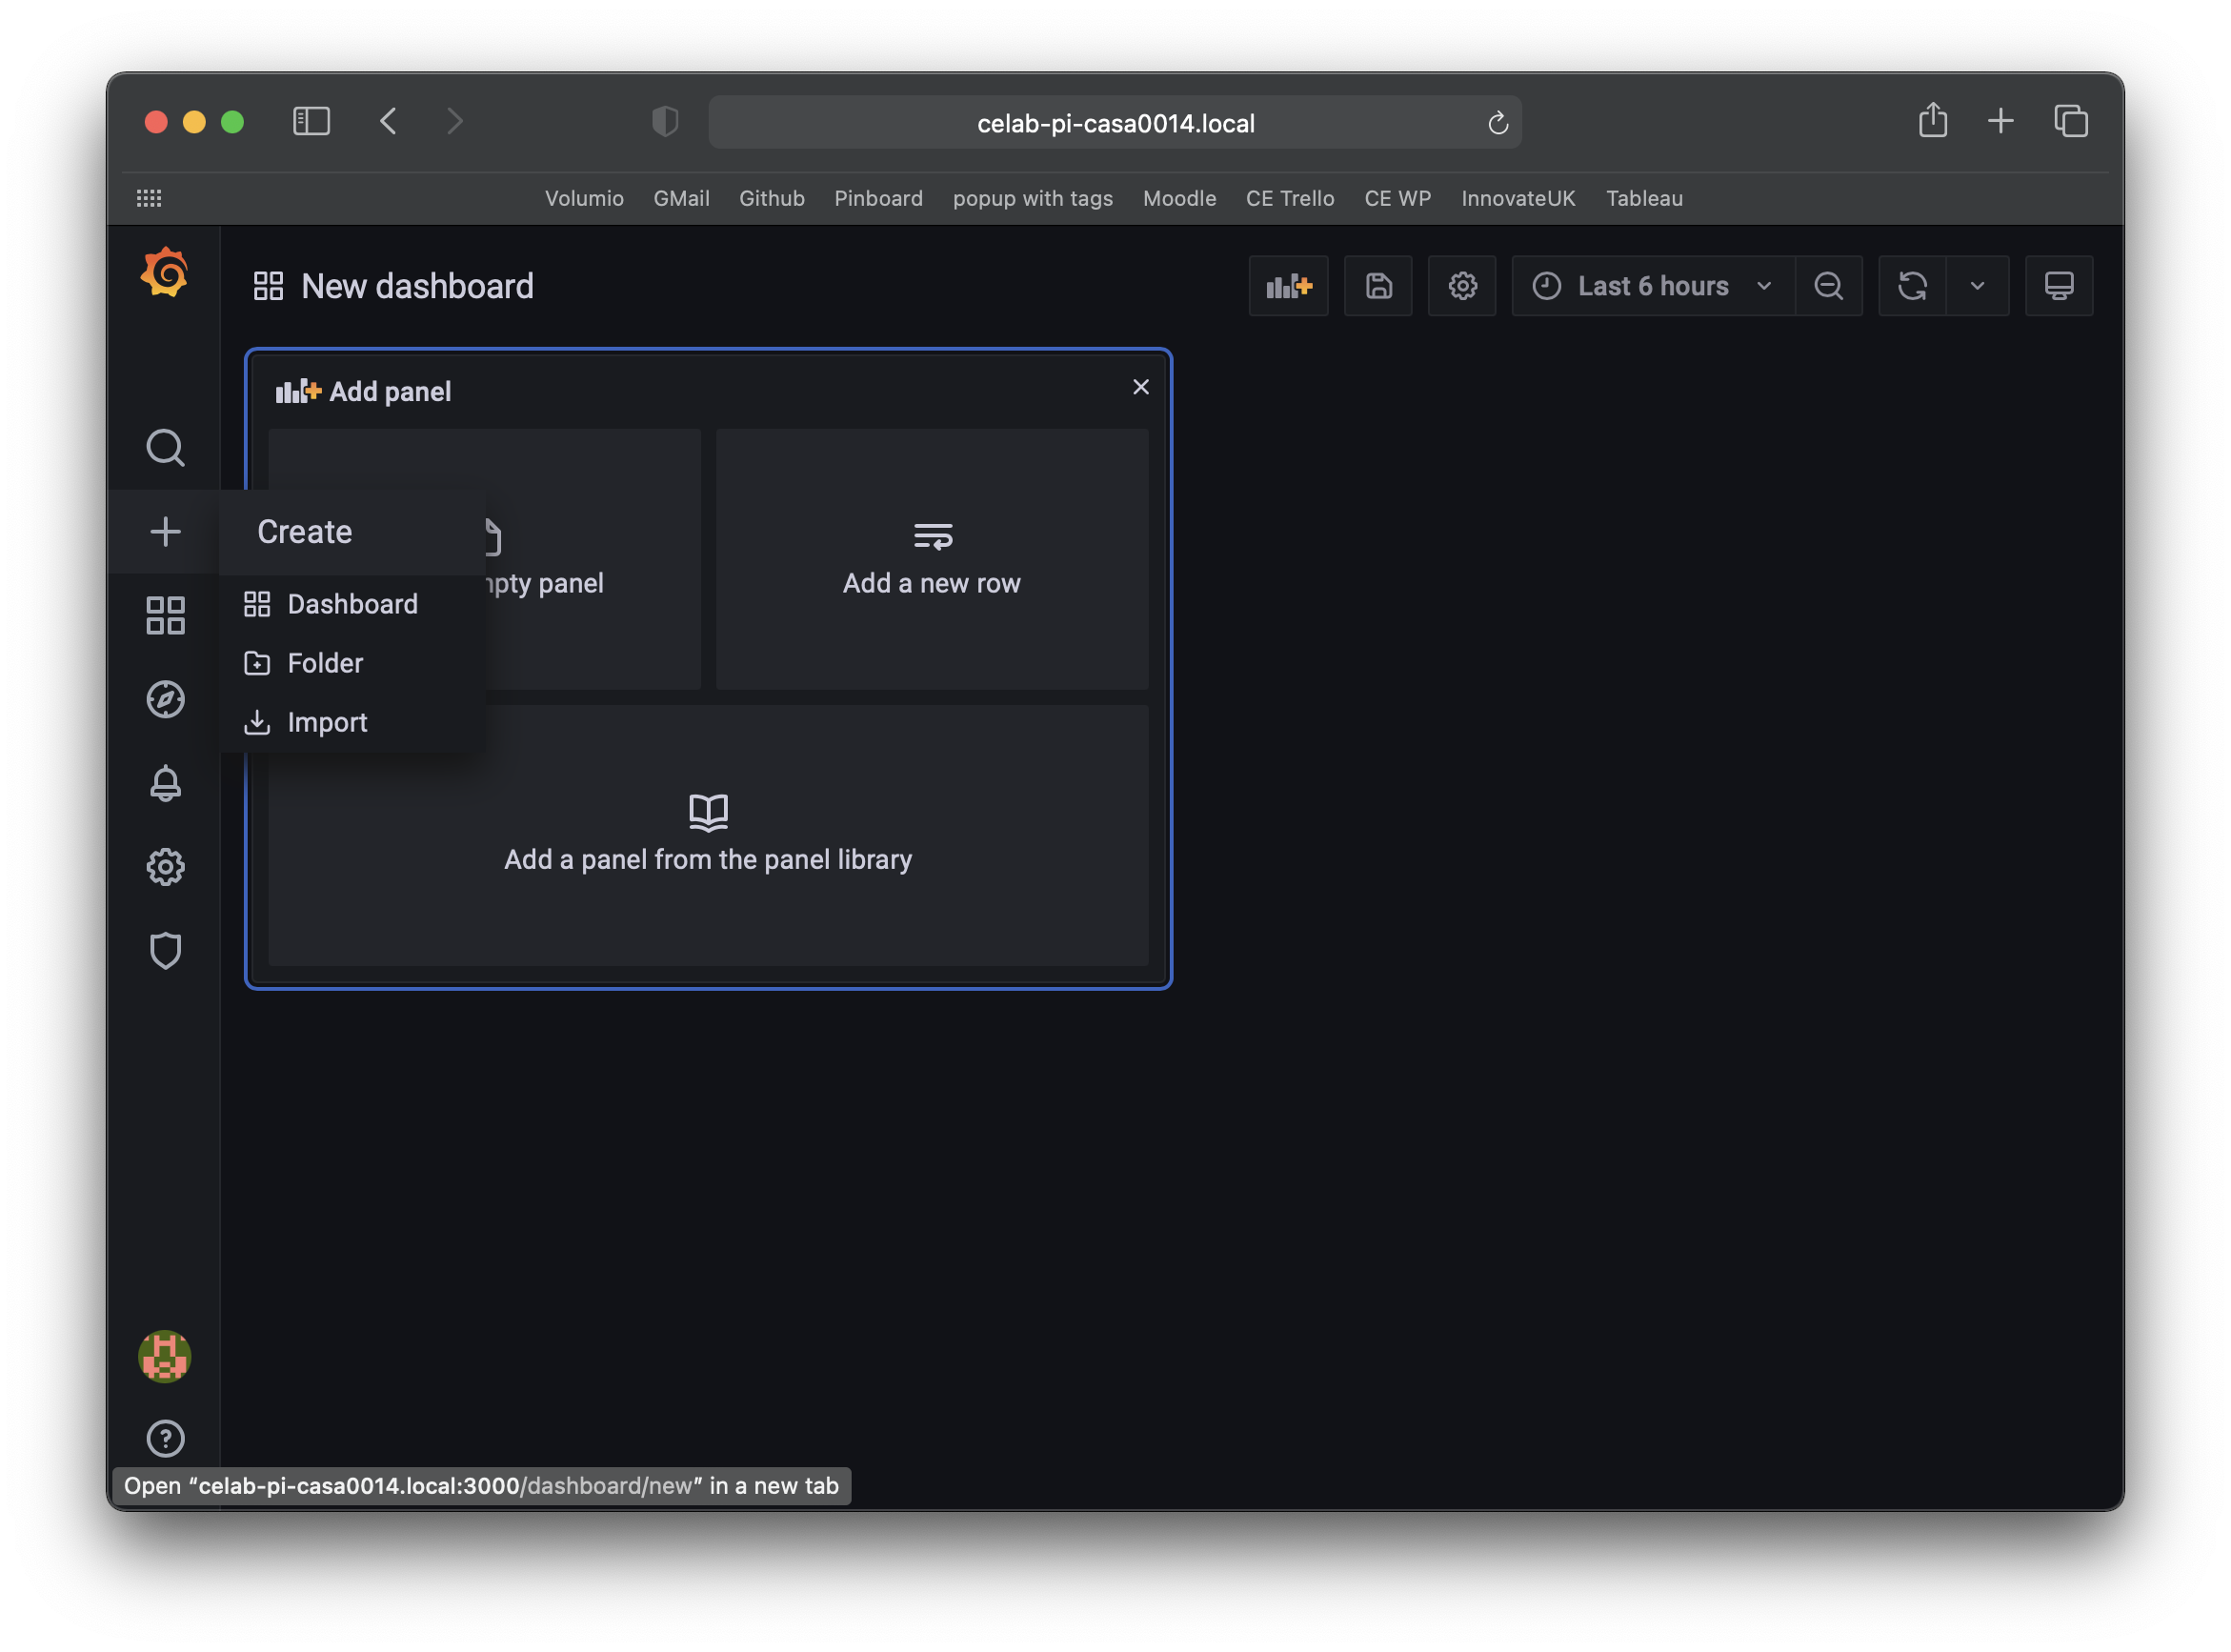
To create a dashboard select Create Dashboard from the + icon in the left navigation and click Empty Panel.
In the query panel you can enter queries just like those used in the Dashboard for InfluxDB. At the bottom of the panel you can also select Sample Query to explore query syntax.
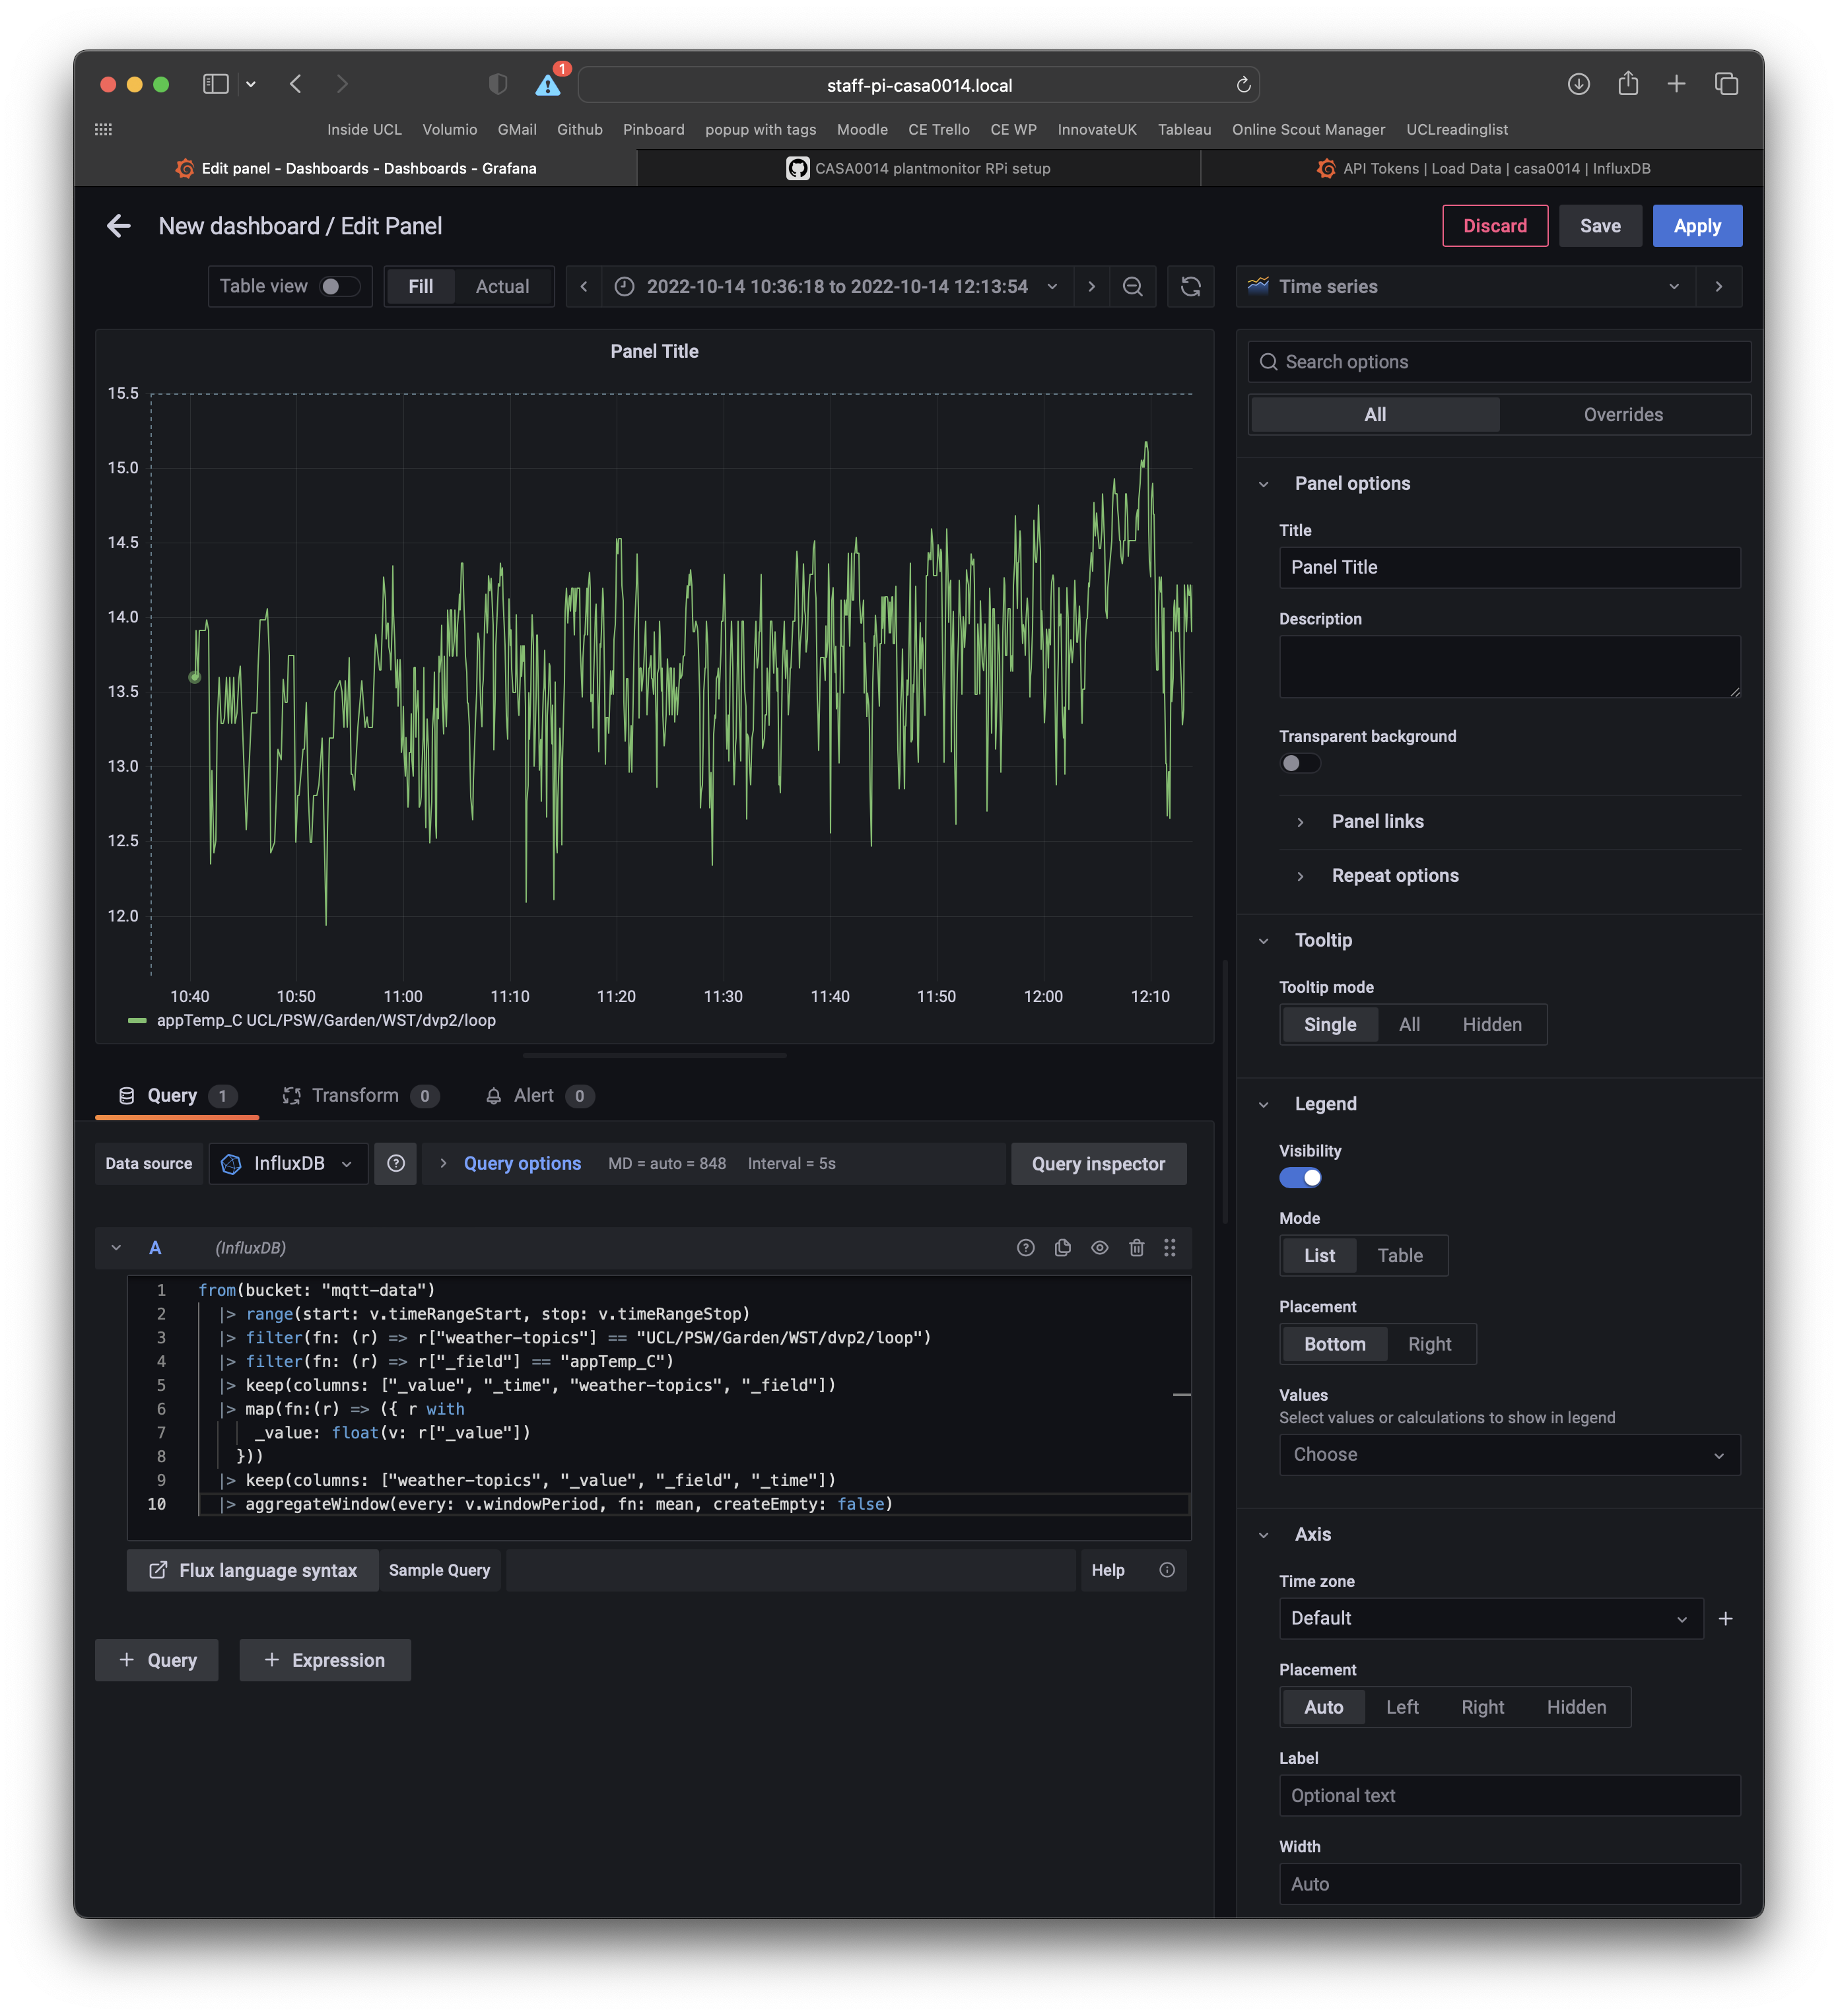
The Flux query language enables you to make some interesting graphs and charts but does require a little time to explore and get used to the syntax. You need to start thinking in terms of filtering down the data in the Buckets where timestamped data has tags, topics, measurements and values associated with them. To get started use the previous queries, copied below, to get started.
Make sure to click Apply and Save (top right). You can also play with the graph settings to change the styles, add a panel title etc.
from(bucket: "mqtt-data")
  |> range(start: v.timeRangeStart, stop: v.timeRangeStop)
  |> filter(fn: (r) => r["_measurement"] == "mqtt_consumer")
  |> filter(fn: (r) => r["plant-topics"] == "student/CASA0014/plant/ucjtdjw/temperature")
  |> filter(fn: (r) => r["_field"] == "value")
  |> aggregateWindow(every: v.windowPeriod, fn: mean, createEmpty: false)
  |> yield(name: "mean")
and with the CE weather station data...
from(bucket: "mqtt-data")
  |> range(start: v.timeRangeStart, stop: v.timeRangeStop)
  |> filter(fn: (r) => r["weather-topics"] == "UCL/PSW/Garden/WST/dvp2/loop")
  |> filter(fn: (r) => r["_field"] == "appTemp_C")
  |> keep(columns: ["_value", "_time", "weather-topics", "_field"])
  |> map(fn:(r) => ({ r with
      _value: float(v: r["_value"])
    }))
  |> keep(columns: ["weather-topics", "_value", "_field", "_time"])
  |> aggregateWindow(every: v.windowPeriod, fn: mean, createEmpty: false)
As a final task, can you think how you could compare your plant data with your classmates? How could you see their data and not just yours?
student/CASA0014/plant since it was a plant monitoring deviceucxxxxx (or whatever you called your plant!) which is hopefully a unique nametemperature | humidity | moisture for each of the three sensor types
Look up how to use regular expressions in Flux...
from(bucket: "mqtt-data")
  |> range(start: v.timeRangeStart, stop: v.timeRangeStop)
  |> filter(fn: (r) => r["_measurement"] == "mqtt_consumer")
  |> filter(fn: (r) => r["topic"] =~ /plant.*/)
  |> filter(fn: (r) => r["_field"] == "value")
  |> aggregateWindow(every: v.windowPeriod, fn: mean, createEmpty: false)
  |> yield(name: "mean")
Endnote.
Sometimes if you mess up your RPi set-up it is easier to just rebuild from scratch. This GIST based on these instructions is a bash script to install the TIG stack on RPi4 (steps 11, 12, 13).